Simple tests on a crushable foam specimen | ||
| ||
ProductsAbaqus/StandardAbaqus/Explicit
Problem description
The simple tests performed in this example are carried out using a cube (one C3D8 element for Abaqus/Standard and one C3D8R element for Abaqus/Explicit) of unit dimensions. Displacements are prescribed at the nodes of the cube to simulate homogeneous deformation and stress conditions. Four different load cases are analyzed in this example using Abaqus/Standard: hydrostatic compression, uniaxial compression, uniaxial tension, and pure shear. These load cases are analyzed using both the volumetric hardening and isotropic hardening models. Since the foam material undergoes very large deformations, geometric nonlinearities are considered in this large-deformation analysis. As the foam model assumes nonassociated flow, the unsymmetric storage and solution scheme is activated. The cases of uniaxial compression and hydrostatic compression are also analyzed using the Abaqus/Explicit volumetric hardening model and the isotropic hardening model, respectively.
![]()
Calibration of material parameters
The elasticity is defined by the Young's modulus, E, and elastic Poisson's ratio, . For the crushable foam model with volumetric hardening, the initial yield surface is defined by k, the ratio of yield stress in uniaxial compression, , to the yield stress in hydrostatic compression, (this is the initial value of ); and , the ratio of yield stress in hydrostatic tension, , to the yield stress in hydrostatic compression, . For the isotropic hardening model, the initial yield surface is defined by k only, but the user needs to provide the plastic Poisson's ratio, which is the ratio of the transverse to the longitudinal plastic strain under uniaxial compression. The evolution of the yield surface is defined by the yield stress versus plastic strain curve in uniaxial compression. For the rate-dependent version of the model we also need the inverse viscosity, D, and the viscous power law coefficient, p.
The model is calibrated for a foam (Dytherm 2.5) for which we have only hydrostatic compression and uniaxial compression data at slow (static) strain rates. The rate-independent calibration is done as follows. The Young's modulus and elastic Poisson's ratio can be obtained easily from the experimental data. From the hydrostatic compression test we immediately obtain the initial yield pressure, . From the uniaxial compression test we obtain the initial yield stress in uniaxial compression, . For the volumetric hardening model, we also need the strength in hydrostatic tension. In the absence of tensile test data we assume the tensile strength, , to be one-tenth of the hydrostatic compression yield strength . For the isotropic hardening model we choose zero plastic Poisson's ratio based on the experimental observation that uniaxial compression of a specimen shows almost no lateral strain. The subsequent yield surface is defined by the hardening curve characterized using uniaxial compression data. The calibration as described above yields the following material parameters for Dytherm 2.5:
3.0 MPa
0.2
0.22 MPa
0.02 MPa
0.2 MPa (this is the initial value of )
1.1
0.1 (for the volumetric hardening model)
0 (for the isotropic hardening model)
To calibrate the rate dependence parameters D and p, it would be necessary to have a number of similar configuration tests performed at different strain rates. Such data are not available for this material.
![]()
Results and discussion
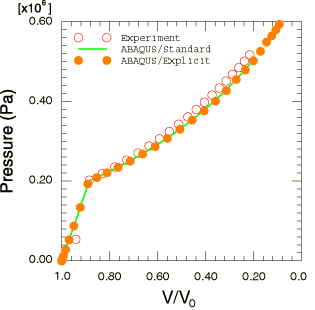
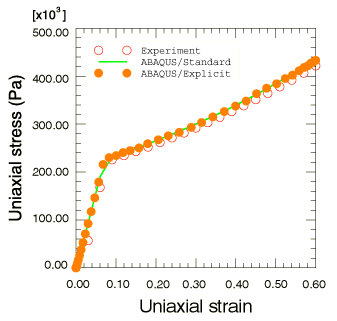
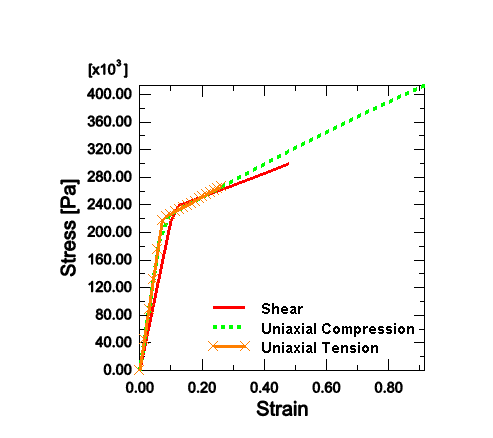
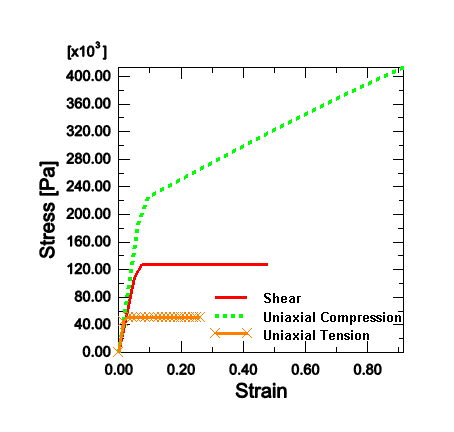
The results obtained with the above calibration are compared to the static experiments of Bilkhu (1987) in Figure 1 (hydrostatic compression) and Figure 2 (uniaxial compression). The Abaqus/Explicit results shown above are obtained from the volumetric hardening model. Good agreement is observed for both tests. Figure 3 and Figure 4 show comparisons of the response of the volumetric hardening model and isotropic hardening model, respectively, for three different monotonic loading paths: uniaxial compression, pure shear, and uniaxial tension. The strain axis represents the deformation in the direction of the major direct stress. The volumetric hardening model correctly predicts a perfectly plastic response for pure shear, as well as any loading condition that gives rise to a negative pressure stress state, such as uniaxial tension, while hardening takes place for any loading condition that gives rise to a positive pressure stress state. The isotropic hardening model, on the other hand, predicts hardening behavior under all loading conditions.
![]()
Input files
- crushablefoam_hydrostatic.inp
Abaqus/Standard hydrostatic compression test using the volumetric hardening model.
- crushablefoam_unicomp.inp
Abaqus/Standard uniaxial compression test using the volumetric hardening model.
- crushablefoam_unitens.inp
Abaqus/Standard uniaxial tension test using the volumetric hardening model.
- crushablefoam_shear.inp
Abaqus/Standard pure shear test using the volumetric hardening model.
- crushablefoam_iso_hydrostatic.inp
Abaqus/Standard hydrostatic compression test using the isotropic hardening model.
- crushablefoam_iso_unicomp.inp
Abaqus/Standard uniaxial compression test using the isotropic hardening model.
- crushablefoam_iso_unitens.inp
Abaqus/Standard uniaxial tension test using the isotropic hardening model.
- crushablefoam_iso_shear.inp
Abaqus/Standard pure shear test using the isotropic hardening model.
- crushfoamvol_hydro.inp
Abaqus/Explicit hydrostatic compression test using the volumetric hardening model.
- crushfoamvol_ucomp.inp
Abaqus/Explicit uniaxial compression test using the volumetric hardening model.
- crushfoamiso_hydro.inp
Abaqus/Explicit hydrostatic compression test using the isotropic hardening model.
- crushfoamiso_ucomp.inp
Abaqus/Explicit uniaxial compression test using the isotropic hardening model.
- crushfoamvol_hydro_c3d8.inp
Abaqus/Explicit hydrostatic compression test using the volumetric hardening model for the sole purpose of testing the performance of the C3D8 element.
- crushfoamvol_ucomp_c3d8.inp
Abaqus/Explicit uniaxial compression test using the volumetric hardening model for the sole purpose of testing the performance of the C3D8 element.
- crushfoamiso_hydro_c3d8.inp
Abaqus/Explicit hydrostatic compression test using the isotropic hardening model for the sole purpose of testing the performance of the C3D8 element.
- crushfoamiso_ucomp_c3d8.inp
Abaqus/Explicit uniaxial compression test using the isotropic hardening model for the sole purpose of testing the performance of the C3D8 element.
- crushfoamvol_hydro_c3d8i.inp
Abaqus/Explicit hydrostatic compression test using the volumetric hardening model for the sole purpose of testing the performance of the C3D8I element.
- crushfoamvol_ucomp_c3d8i.inp
Abaqus/Explicit uniaxial compression test using the volumetric hardening model for the sole purpose of testing the performance of the C3D8I element.
- crushfoamiso_hydro_c3d8i.inp
Abaqus/Explicit hydrostatic compression test using the isotropic hardening model for the sole purpose of testing the performance of the C3D8I element.
- crushfoamiso_ucomp_c3d8i.inp
Abaqus/Explicit uniaxial compression test using the isotropic hardening model for the sole purpose of testing the performance of the C3D8I element.
![]()
References
- Private Communication, 1987.
![]()
Figures


