Smoothing an X–Y data object

Use the smooth function or the smooth2 function to operate on a previously saved X–Y data object (a collection of ordered pairs) to produce a new X–Y data object having a smoother curve. The new X–Y data object has the same X-coordinate values as the original X–Y data object. At each X-coordinate Abaqus/CAE computes the new Y-coordinate as the average of neighboring Y-coordinates of the original data object. This computation is known as a moving average. The two functions use different algorithms to calculate this moving average value:

  • The smooth function uses a simple moving average to calculate the new Y-coordinate values, which means that each new Y-coordinate is the unweighted mean of a number of neighboring points. You can specify the number of neighboring points to include in the average; a larger value produces a smoother curve. Abaqus/CAE interprets the value you specify as the number of points to use on either side of the current X-coordinate. The default is 2, which means Abaqus/CAE averages 5 values to compute each new Y-coordinate.

  • The smooth2 function uses an exponential moving average to calculate the new Y-coordinate values, which means that the neighboring points have an exponentially greater influence on the resulting Y-coordinate value. You can specify a smoothing factor between 0 and 1 for the curve; a smaller value produces a smoother curve. The default smoothing factor is 0.75.

Related Topics
Applying sine-Butterworth filtering to an X–Y data object
Applying SAE filtering to an X–Y data object
Using X–Y data operations
Reducing the sample size of an X–Y data object

Context:

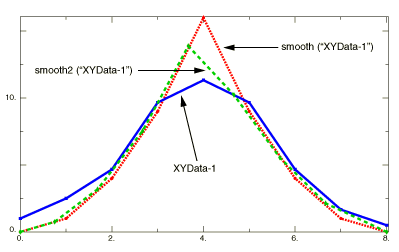
Figure 1 illustrates the type of X–Y plot that can be produced using the smooth and smooth2 functions.

Figure 1. X–Y plots produced using the smooth and smooth2 functions.

  1. Locate the Operate on XY Data dialog box.

    From the main menu bar, select ToolsXY DataCreate. Click Operate on XY data in the dialog box that appears; then click Continue. The Operate on XY Data dialog box appears.

  2. From the Operators listed, click smooth(X, I) or smooth2(X, F).

    The smooth or smooth2 function appears in the expression window.

  3. From the XY Data choices, click the name of the X–Y data object on which to operate and click Add to Expression. You can choose from all X–Y data objects previously saved within this session (listed alphabetically in the XY Data field).

    The X–Y data object name appears within the smooth or smooth2 function parentheses in the expression window.

  4. Position your cursor in the expression window before the second comma, and enter the following value:

    • For the smooth function, enter an integer value for the number of points on either side of a given point to include in the average.

    • For the smooth2 function, enter a decimal value between 0 and 1 to determine the smoothing factor for the curve. A smaller value produces a smoother curve.

  5. To continue to build your expression, position the cursor in the expression window and type in or select the functions, operators, and X–Y data you want to include.

  6. To evaluate and display your expression, click Plot Expression.

  7. To save your new X–Y data object, click Save As and then provide a name in the dialog box that appears.

    Saving your data object makes it available for future operations within this session and for inclusion in X–Y plots containing multiple data objects.

  8. When you are finished, click Cancel to close the dialog box.