About the Engineering Data Mining Tool | ||
| ||
When multiple objectives are defined in problem formulations, there is no single best point; instead, Isight creates a set of points (i.e., a Pareto set) from which tradeoffs can be made. For any one of these points, no improvement can be made in one objective without giving something up in another objective. Although the Pareto set can be determined for all components that have at least two objectives, more accurate approximation of the true Pareto set is obtained when multi-objective optimization techniques are used. Isight supports the following multi-objective techniques:
-
Archive-Based Micro Genetic Algorithm (AMGA)
-
Multi-Objective Particle Swarm
-
Neighborhood Cultivation Genetic Algorithm (NCGA)
-
Non-dominated Sorted Genetic Algorithm (NSGA-II)
For more information on these techniques, see About the Optimization Techniques in the Isight Component Guide.
You can use the EDM tool to create and manipulate multiple variable and multiple response plots, which are referred to as parallel coordinate graphs. These plots facilitate multi-criteria decision making.
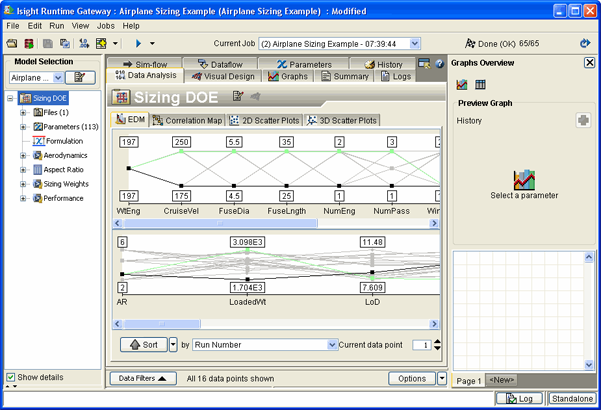
The following figure shows an example of the parallel coordinate graphs created using the EDM tool:

The two parallel coordinate graphs display the input and output parameter information for each run (top and bottom, respectively) of the selected component. Each graph consists of all inputs and outputs (depending on the graph you are viewing) displayed across the X-axis, with each value for each variable displayed in increasing order above that variable. Variable values for each input or output are linked by a sequential line graph to represent each design point. By default, each parameter is displayed on an individual scale, taking the full range of the graph (normalized). You can change how the data are normalized (see Viewing the Parallel Coordinate Graphs).
All the parameters in the selected component are used to create the information displayed in the parallel coordinate graphs. If the selected component has more than 30 inputs or outputs, only the first 30 are used. However, you can change which parameters are used (see Changing the Parameters Used by the EDM Tool).
Note:
If the visual appears with a yellow background and
a ![]() button in the top left corner, only a limited number
of runs have been included in the graph. For more information, see Using Data Sampling.
button in the top left corner, only a limited number
of runs have been included in the graph. For more information, see Using Data Sampling.