Using Data Sampling

If you are working with a complex model that has many runs, you can limit the number of runs that Isight displays in graphs, the Engineering Data Mining tool, and 2D and 3D scatter plot graphs. If the number of runs available to display exceeds the limit specified, Isight samples the data uniformly to stay within the limit.


Before you begin: You must set the Preference option to limit the number of runs displayed in visuals (see Setting Execution Preferences).
  1. Click the Sampled data button in the left top corner of the visual to change the number of runs appearing in the visual.

    The Sampled data dialog box appears.

  2. Enter the number that you want to use begin data sampling.

    The graphs are updated automatically, and the preference option will reflect the value you just entered.

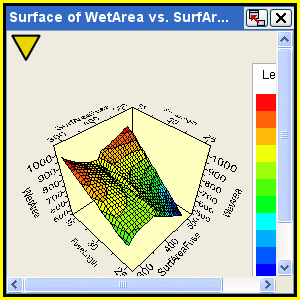
    The visual appears with a yellow background to indicate that you have limited the number of runs included as shown below.


    Note: Each point in multiline/overlay visuals (e.g., Engineering Data Mining and history graphs with overlay) counts against the limit. Therefore, data sampling begins sooner with these visuals than simpler visuals. For example, a history graph showing 10 parameters on one graph when there are 100 runs requires the points in the graph to be 1000 or higher to not begin data sampling.

  3. Save the model, if desired.