Response spectra of a three-dimensional frame building | ||
| ||
ProductsAbaqus/Standard
Geometry and model
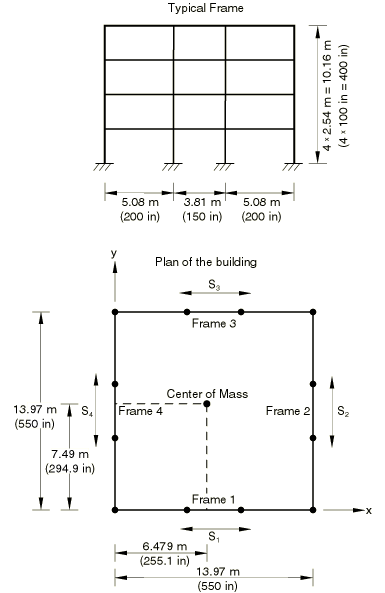
A four-story steel-frame building is analyzed. All columns in the building have the same geometric properties. However, as shown in Figure 1, the properties of the beams in Frames 1 and 2 are different, as compared to those in Frames 3 and 4, to move the center of mass of the structure away from its geometric center. Eigenvalue extraction performed on the model shows that many of the 30 modes that cover the frequency range up to 40 Hz are closely spaced. An acceleration spectrum based on the El Centro earthquake record is applied in the x–y plane. The Fortran program given in frameresponsespect_acc.f is used to generate the spectrum. The frequency range is chosen between 0.1 Hz and 40 Hz, and the number of points at which the spectrum is calculated is set at 501. Only one spectrum curve is requested for 2% damping.
![]()
Results and discussion
As described in Linear analysis of a rod under dynamic loading, for structures with well-separated modes the TENP and the CQC methods reduce to the SRSS method, while the NRL and the ABS methods give similar results. Hence, for such structures, two summation rules would suffice, with ABS providing the more conservative results. However, when structures with closely spaced modes are analyzed, all five summation rules can yield very different results. This is even more apparent in three-dimensional problems. In the present example, the plane of the earthquake motion lies along the x-axis, so we expect that the structural response will be dominated by Frames 1 and 3 and will result in a significant base shear in the x-direction. All five methods are compared against a modal time history response using the same El Centro acceleration record in Table 1, where the base shear forces are summed up in the plane of each frame , where i is the frame number. This comparison shows that the best approximation is generated by the CQC method. The other methods overestimate the shear in the y-direction, and some of them underestimate the base shear in the x-direction. The CQC method is generally recommended for asymmetrical three-dimensional problems with closely spaced structural modes. This method takes into account the sign of the mode shapes through cross-modal correlation factors and can correctly predict the response in directions perpendicular to the direction of excitation.
![]()
Input files
- frameresponsespect_freq.inp
FREQUENCY analysis.
- frameresponsespect_rs.inp
RESPONSE SPECTRUM analysis.
- frameresponsespect_modal.inp
MODAL DYNAMIC analysis. To run this file, the user must fetch the file cantilever_quakedata.inp and copy it to QUAKE.AMP.
- frameresponsespect_acc.f
Fortran program that will produce the acceleration spectrum needed to run frameresponsespect_rs.inp. To run this program, the user must fetch the file cantilever_quakedata.inp and copy it to QUAKE.AMP.
![]()
Tables
| Method | (kip) | (kip) | (kip) | (kip) |
|---|---|---|---|---|
| Time history | −25.5 | 14.0 | −37.0 | −22.8 |
| ABS/ALG | 48.3 | 48.3 | 65.1 | 65.1 |
| SRSS/ALG | 18.4 | 18.4 | 24.8 | 24.8 |
| TENP/ALG | 28.9 | 28.9 | 35.9 | 35.9 |
| NRL/ALG | 25.9 | 25.9 | 34.6 | 34.6 |
| CQC/ALG | 23.3 | 13.0 | 29.0 | 20.7 |
![]()
Figures