Context: To perform negation, precede a single X–Y data object with the operator. Negation yields a new X–Y data object having the same X-coordinate values as the original X–Y data object. Abaqus/CAE computes the new Y-coordinates as the negative of each original Y-coordinate. To perform subtraction, use one of three methods:
- To subtract a scalar from an X–Y data object:
This method yields a new X–Y data object having the same X-coordinate values as the original X–Y data object. Abaqus/CAE computes the new Y-coordinates as the scalar subtracted from each original Y-coordinate. For example, if
then
- To subtract an X–Y data object from a scalar:
This method yields a new X–Y data object having the same X-coordinate values as the original X–Y data object. Abaqus/CAE computes the new Y-coordinates as each original Y-coordinate subtracted from the scalar. For example, if
then
- To subtract one X–Y data object from another X–Y data object:
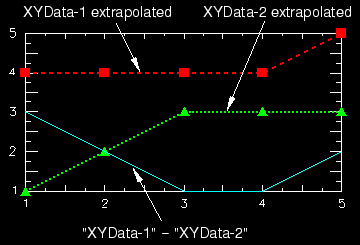
This method yields a new X–Y data object having as its X-coordinates all X-coordinates of the first data object and any additional X-coordinates needed for alignment of the two objects. Abaqus/CAE computes additional X–Y data pairs by interpolation and extrapolation. The new data object has as its Y-coordinates the Y-coordinates of the second data object subtracted from the Y-coordinates of the first data object. For example, let
and
For alignment, Abaqus/CAE computes the values of the first and second data objects as:
and
then
Figure 1 shows an X–Y plot of the above example.
Figure 1. X–Y plot illustrating subtraction of data objects.
Locate the Operate on XY Data dialog box. From the main menu bar, select . Click Operate on XY data in the dialog box that appears; then click Continue. The Operate on XY Data dialog box appears. From the Operators listed, click . The symbol appears in the expression window. Use your mouse and keyboard to position the cursor in the expression window; then specify the necessary arguments. Available X–Y data objects include all those previously saved within this session (listed alphabetically in the XY Data field).
- To use negation
From the XY Data choices, click the name of the X–Y data object to negate and click Add to Expression.
- To use subtraction
-
-
Use your keyboard to type in a scalar argument, or
-
From the XY Data choices, click the name of the X–Y data object on which to operate and click Add to Expression.
The arguments appear within the expression window. To continue to build your expression, position the cursor in the expression window and type in or select the functions, operators, and X–Y data you want to include. To evaluate and display your expression, click Plot Expression. To save your new X–Y data object, click Save As and then provide a name in the dialog box that appears. Saving your data object makes it available for future operations within this session and for inclusion in X–Y plots containing multiple data objects. When you are finished, click Cancel to close the dialog box.
|