Raising an X–Y data object to a power

Use the power function to operate on a previously saved X–Y data object (a collection of ordered pairs) to produce a new X–Y data object. The power function requires two arguments, at least one of which must be an X–Y data object. This function can be applied in three ways:

To raise a scalar to an X–Y data object: power(scalar, data object name).

This method yields a new X–Y data object having the same X-coordinate values as the original X–Y data object. Abaqus/CAE computes the new Y-coordinates as the scalar raised to the power of each original Y-coordinate. For example, if

XYData=[(1,1),(2,2),(3,3)],

then

power(2, XYData)=[(1,2),(2,4),(3,8)].
To raise an X–Y data object to a scalar: power(data object name, scalar).

This method yields a new X–Y data object having the same X-coordinate values as the original X–Y data object. Abaqus/CAE computes the new Y-coordinates as each original Y-coordinate raised to the scalar. For example, if

XYData=[(2,-2),(3,3),(4,-4)],

then

power(XYData, 2)=[(2,4),(3,9),(4,16)].
To raise an X–Y data object to another X–Y data object: power(data object name, data object name).

This method yields a new X–Y data object having as its X-coordinates all X-coordinates of the first data object and any additional X-coordinates needed for alignment of the two objects. Abaqus/CAE computes additional X–Y data pairs by interpolation and extrapolation. The new data object has as its Y-coordinates the Y-coordinates of the first data object raised to the Y-coordinates of the second data object. For example, let

XYData1=[(1,1),(2,2),(4,2),(5,1)],

and

XYData2=[(0,1),(3,2),(5,6)].

For alignment, Abaqus/CAE computes the values of the first and second data objects as:

XYData1 extrapolated=[(0,1),(1,1),(2,2),(3,2),(4,2),(5,1)],

and

XYData2 extrapolated=[(0,1),(1,1.33),(2,1.66),(3,2),(4,4),(5,6)];

then

power(XYData1, XYData2)=[(0,1),(1,1),(2,3.17),(3,4),(4,16),(5,1)].

Related Topics
Taking the exponential of an X–Y data object
Understanding X–Y data interpolation and extrapolation
Using X–Y data operations

Context:

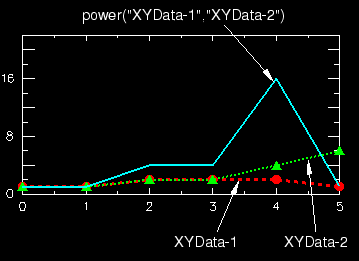
Figure 1 shows a plot of the above example.

Figure 1. X–Y plot of one data object raised to another data object.

  1. Locate the Operate on XY Data dialog box.

    From the main menu bar, select ToolsXY DataCreate. Click Operate on XY data in the dialog box that appears; then click Continue. The Operate on XY Data dialog box appears.

  2. From the Operators listed, click power(A,A).

    The power function appears in the expression window.

  3. From the XY Data choices, click the name of the X–Y data object on which to operate and click Add to Expression. You can choose from all X–Y data objects previously saved within this session (listed alphabetically in the XY Data field).

    The X–Y data object name appears within the power function parentheses in the expression window.

  4. To specify the next argument, do one of the following:

    • Use your mouse and keyboard to enter a scalar as either the first or second argument of the power function in the expression window, depending on the operation you want to perform, and to separate the two arguments with a comma, or

    • From the XY Data choices, click the name of a data object argument for the power function in the expression window and click Add to Expression.

  5. To continue to build your expression, position the cursor in the expression window and type in or select the functions, operators, and X–Y data you want to include.

  6. To evaluate and display your expression, click Plot Expression.

  7. To save your new X–Y data object, click Save As and then provide a name in the dialog box that appears.

    Saving your data object makes it available for future operations within this session and for inclusion in X–Y plots containing multiple data objects.

  8. When you are finished, click Cancel to close the dialog box.