Context:
When an output database is selected,
Abaqus/CAE
lists for your selection all vector and tensor variables available at the
current
step and frame of your
output database by default;
resultant values are displayed in vector variable symbol plots, and all
principal components are displayed in tensor variable symbol plots. An asterisk
to the left of the description indicates that the variable includes complex
number results.
When a model from the current model database is selected,
Abaqus/CAE
lists for your selection all loads, predefined fields, boundary conditions, and
interactions available at the current step of your model by default. All of
these selectable items are preceded by a letter in parentheses to distinguish
them by category: (L) for loads, (P)
for predefined fields, (B) for boundary conditions, and
(I) for interactions.
Use the Symbol Variable options in the Field
Output dialog box to choose the variable and the specific components
that you want. For information on individual output variable identifiers, see
Output Variables.
When you display a vector variable in a symbol plot, you can choose from the
following options:
Figure 1. Symbol plots showing total displacement (left) and displacement in the
1-direction (right).
Likewise, when you display a tensor variable in a symbol plot, you can
choose from the following options:
Display arrows that represent each of the principal components of the
variable. For example, a symbol plot of maximum, intermediate (mid), and
minimum principal stress appears on the left side of
Figure 2.
Display arrows that represent a specific principal component of the
variable. For example, a symbol plot of only maximum principal stress appears
on the right side of
Figure 2.
Figure 2. Symbol plot showing all three principal components (left), and symbol
plot showing only maximum principal stress (right).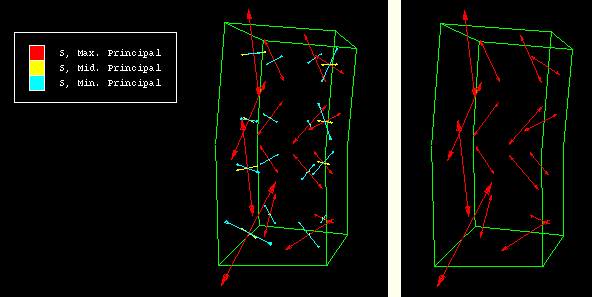
Display arrows that represent each of the direct components of the
variable. For example, a symbol plot of all direct components appears on the
left side of
Figure 3.
Display arrows that represent a specific direct component of the
variable. For example, a symbol plot of only S22 appears on the right side of
Figure 3.
Figure 3. Symbol plot showing all direct components (left), and symbol plot
showing only S22 (right).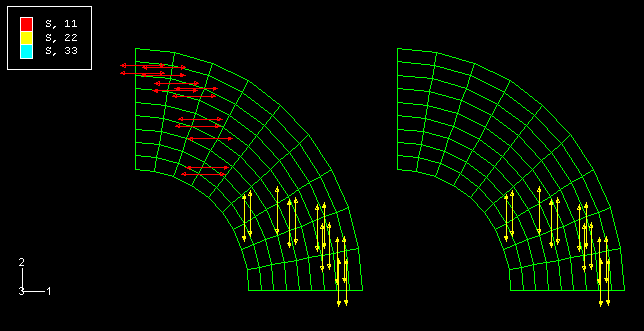
Locate the options that control the symbol field output variable.
From the main menu bar, select. Click the Symbol
Variable tab in the dialog box that appears.
The Symbol Variable options appear.
To see the complete descriptions of the variables listed, increase the
width of the dialog box by dragging one corner.
To control which variables appear in the Name and
Description list:
- Toggle List only variables with results to
display a list that is limited by the storage location of the variables.
Limiting the list helps you select variables by presenting, for example, only
integration point quantities.
When List only variables with results is on,
filter options become available in the pull-down menu.
- Click the List only variables with results
arrow to reveal the filter options.
- Click the text stating the location of the variables you want to
include in the Name and Description
list.
The text appears in the List only variables with
results box, and the Name and
Description list is refreshed to include only variables
having that location.
From the Name and
Description list, click the name of the analysis variable
that you want. An asterisk to the left of the description in the list indicates
that the variable includes complex number results.
The selected variable is highlighted. The Vector
Quantity, Tensor Quantity, and
Component lists on the bottom of the dialog box are
refreshed to display available vector quantities, tensor quantities, and
components, respectively.
If you are creating a vector variable symbol plot, select the
components to plot.
If you are creating a tensor variable symbol plot, select the
component to plot.
Select to
display arrows that represent all available principal components.
Select and
the component that you want to display only arrows that represent a particular
principal component.
Select to display
arrows that represent all three direct components.
Select and
the component that you want to display only arrows that represent a particular
direct component.
Note:
For S and E field output, there are two invariants, Max.
Principal (abs) and Max. In-Plane Principal
(abs), which are available only in
the Visualization module.
Max. Principal (abs) is the largest principal value when
the absolute value of all principal values are compared. Max.
In-Plane Principal (abs) is the largest principal value when the
absolute value of all in-plane principal values are compared. The out-of-plane
principal value is not considered when the Max. In-Plane Principal
(abs) value is computed.
Click Apply to implement your changes.
The symbol plot in the current viewport changes to show values for
the analysis variable you have specified. If active, the text in the legend and
state block changes to identify the variable associated with the plot. For more
information on the legend and state block, see
Customizing the legend,
and
Customizing the state block.
Your changes are saved for the duration of the session.