Context:
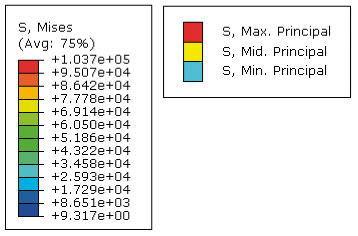
Figure 1 shows a contour plot legend and a symbol plot legend.
Figure 1. Contour plot legend and symbol plot legend.
You can display or suppress legends for all plot states, and you can customize the following:
the position of the legend,
the font and color of the legend text,
the appearance of a box outlining the legend,
whether minimum and maximum plot values are shown,
the appearance of the legend background (the rectangular area behind the legend),
the formatting of the numbers displayed for the digit values, and
the number of digits displayed for the legend values.
You cannot directly specify the size of the legend. However, by varying the size of the text font or the number of digits in the legend values, you can increase or decrease the legend's size.
The content of the legend depends on the plot type and on plot state–specific options such as the number of contour intervals. For more information on contour plot legend content, see Understanding contour plotting.
This section describes how to customize the legend for all plot states except X–Y plots. To customize the X–Y plot legend, see Customizing the X–Y plot legend.
Locate the Legend options.
From the main menu bar, select .
To display or suppress legends for all plot states except X–Y plots, toggle Show legend in the General tab.
When Show legend is on, legend options become available.
Click the Legend tab. The basic legend options are at the top of the Legend page.
To display or suppress a box outlining the legend, toggle Show bounding box. This bounding box visually separates the legend from the underlying plot.
To display or suppress the minimum and maximum values associated with contour plots, toggle Show min/max values.
Establish the position of the upper left corner of the legend.
To control the X- or -position, click the % Viewport X or % Viewport Y boxes, respectively. Enter the positions you want as a percentage of the total width of the current viewport.
Customize the legend text font.
- Click Set Font.
The Select Font dialog box appears.
- Use the Select Font dialog box to choose the font characteristics you want. For more information, see Customizing fonts.
- When you are done, click OK to implement your changes and to close the Select Font dialog box.
Choose the color of the legend text.
- Click the color sample
 .
.Abaqus/CAE displays the Select Color dialog box.
- Use one of the methods in the dialog box to select a new color. For more information, see Customizing colors.
- Click OK to close the Select Color dialog box.
The color sample changes to the selected color.
To customize the background, click one of the following:
-
Match viewport to match the background to the viewport color.
-
Transparent to eliminate the background and show only the text.
-
Other color to reveal other background color options.
If you selected Other color:
- Click the color sample .
Abaqus/CAE displays the Select Color dialog box.
- Use one of the methods in the Select Color dialog box to select a new color. For more information, see Customizing colors.
- Click OK to close the Select Color dialog box.
The color sample changes to the selected color.
To change the format of the legend values, click the Format arrow and select one of the following formats:
-
Select Scientific to display legend values in scientific notation, which expresses legend values as a decimal value between 1 and 10 multiplied by a power of 10. When you select this format for the number 501,000, the value appears in the legend as 5.01e5.
-
Select Fixed to display legend values without using exponent values. When you select this format, the number 501,000 is displayed in the legend as 501000.00.
-
Select Engineering to select engineering notation, which expresses values in a similar format to scientific notation but allows exponent values that are multiples of three only. When you select this format, the number 501,000 is displayed in the legend as 501E3.
Note:
All three of these examples are displayed with two decimal places. Your legend values may be displayed differently if you change the Decimal places option.
To choose the number of digits shown in legend values, click the Decimal places arrow. For legend values in scientific or fixed format, the Decimal places option controls the number of digits to the right of the decimal point. For legend values in engineering format, this option controls the number of significant digits to the left of the exponent value. For all formats, larger Decimal places values require more display space.
The specified number of digits appears in the Decimal places box.
Click Apply to implement your changes.
In the current viewport, legends for all plots change to reflect your specifications, which are saved for the duration of the session.