Customizing contour intervals | |||||||
|
| ||||||
Context:
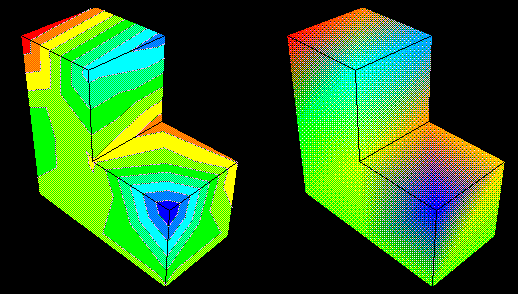
By default, there are 12 discretely colored intervals. Figure 1 shows a banded-type contour plot with nine uniform contour intervals on the left and with continuous contours on the right.
When you represent contour plots using discrete intervals, you can also control the type of progression between interval values. If you choose a uniform interval type, Abaqus/CAE creates a uniform, arithmetic progression between the interval values; if you choose a logarithmic interval type, Abaqus/CAE creates a logarithmic progression between interval values. In addition, you can create a new set of contour intervals with a custom progression that includes any values that you want to include. You can also provide just a few interval values and interpolate additional intervals between the values you define. The interval values you provide must appear in descending order from top to bottom in the Edit Intervals dialog box.
If you select a custom interval, Abaqus/CAE overrides the contour limits specified in the Limits area of the Contour Plot Options dialog box and uses the maximum and minimum interval values as the custom contour limits. See Setting contour limits, for more information.
If you select custom contour intervals and subsequently modify the intervals, the smaller the number of contour intervals increases the likelihood that your interval modifications will result in changes to the contour plot.
The contour legend, if active, will include two more intervals than the number you choose. Abaqus/CAE adds intervals at the top and bottom of the legend to indicate any values that exceed the contour plot limits. For more information on the contour legend, see Customizing the legend.
This section describes how to customize the contour intervals and how to edit the contour intervals that you use.
For Discrete intervals, perform the following tasks:
-
Choose the number of intervals by dragging the Contour Intervals slider to the number of intervals (between 2 and 24) that you want.
-
Choose one of the following selections from the Interval type list:
-
Select Uniform to use an arithmetic progression of values in the contour plot.
-
Select Log to use a logarithmic progression of values in the contour plot.
-
Select User-defined to use a customized set of values in the contour plot.
-
-
To customize interval values for the User-defined interval type, click
 .
.
The dialog box appears with a default set of contour intervals that you can modify in any of the following ways:
-
Edit any interval value by clicking its row and entering a new value. You must provide interval values in descending order from top to bottom in the dialog box.
-
Click or to insert another interval before or after the selected interval. New intervals are added without values, so you must supply interval values either by entering them directly in the appropriate row or by interpolating their values.
-
Click to remove the selected intervals from the set.
-
Click to calculate interpolated interval values for all blank intervals in the set. Abaqus/CAE interpolates values using an arithmetic progression.
-
Click to clear the values for the selected intervals.
When you have completed your set of contour intervals, click to close the Edit Intervals dialog box.
-
-