Viewing an XFEM crack | ||
| ||
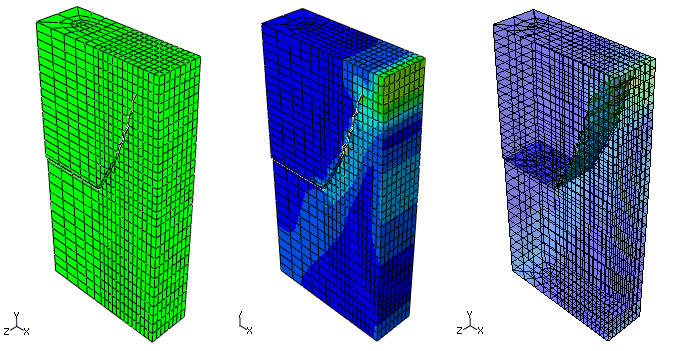
You can perform a time history animation of a contour plot and view the onset of damage calculated by XFEM. The animation also allows you to view the propagation of the damage through the enriched region as the analysis progresses. Turning on translucency allows you to see the progression of the crack through interior elements. For more information, see Changing the translucency.
To view the initial crack front, you can create an isosurface cut shape with PSILSM selected as the current primary field output variable. For more information, see Creating or editing a view cut.
If you want to investigate the crack in more detail, you can create a contour plot of the signed distance function (PHILSM) and determine in which elements the signed distance values are negative or positive. The crack surface is situated in the elements where the value of PHILSM transitions from a negative number to a positive number. In addition, you can use the  option in the View Cut Manager to view only the surface where the value of the signed distance function is zero, which corresponds with the surface of an XFEM crack. For more information, see Understanding view cuts.