Monitoring the progress of an analysis job | |||||||
|
| ||||||
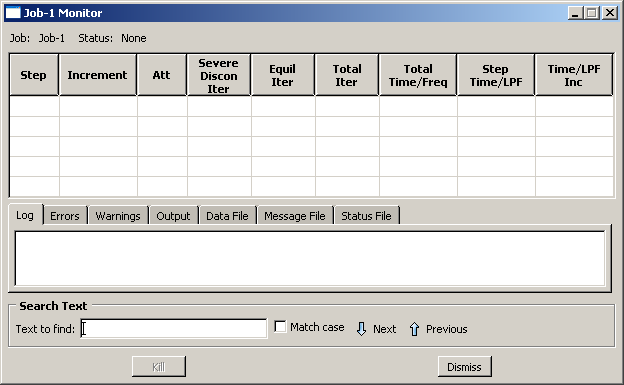
You can monitor information concerning a submitted job by selecting from the main menu bar or by selecting the job of your choice and clicking in the Job Manager. The job monitor dialog box for that job appears, as shown in Figure 1. You can display as many job monitors as necessary to view information on multiple jobs.
The jobs submitted for a co-execution appear in the Model Tree in the Jobs container under the co-execution in the Co-executions container. You can monitor these jobs by clicking mouse button 3 on the job in the Model Tree and selecting Monitor.
The top half of the job monitor dialog box displays the information available in the status file that Abaqus creates for the analysis. The table headings are customized for each job based on the settings sent from the analysis. The bottom half of the dialog box displays the following information:
-
Click the Log tab to display the start and end times that appear in the log file for the analysis.
-
Click the Errors and Warnings tabs to display the errors or the warnings associated with the analysis. Abaqus/CAE indicates the presence of errors or warnings by prepending an exclamation point before the Errors and Warnings tab. If a particular region of the model is causing the error or warning, a node or element set will be created automatically that contains that region. The name of the node or element set appears with the error or warning message, and you can view the set using display groups in the Visualization module. (For more information on display groups, see Using display groups to display subsets of your model.”)
Abaqus/CAE may not perform all consistency checks when it creates an input file, which can result in warnings or error messages during an analysis. If your analysis generates warning or error messages, consider running a data check analysis (see Performing a data check on a model) to diagnose and fix possible problems in your model.
The number of error and warning messages that appear in the job monitor is limited by the environment parameters cae_error_limit and cae_warning_limit, respectively (see Job customization parameters, for details). If the number of errors or warnings exceeds the job monitor limit, consult the data, message, or status file for a complete list of messages.
-
Click the Output tab to display a record of each output data entry as it is written to the output database. In addition, if you requested that Abaqus monitor the values of a degree of freedom of a particular node to the message and status files, the Output tabbed page records each time this information is written and the value of the degree of freedom at that point of the analysis. (For more information, see Understanding output requests, and Degree of freedom monitor requests.)
-
As the analysis proceeds, Abaqus creates the following files:
-
Abaqus/Standard: Data file, message file, and status file
-
Abaqus/Explicit: Data file, message file, and status file
Abaqus/CAE activates the Data File, Message File, and Status File tabs accordingly. You can click any of these tabs to browse or search the corresponding file for additional error and warning messages.
Note:
Abaqus/CAE populates the Data File, Message File, and Status File tabbed pages only for locally submitted analyses; this information will not be displayed in the job monitor for remote jobs. In addition, although Abaqus/CAE updates the contents of these pages periodically as the analysis runs, the data might not always be synchronized with the latest data in the files.
-
For detailed information on the different output files that Abaqus creates during an analysis, see About Output.
You can search for specific error or warning messages within any of the files displayed in tabbed pages in the job monitor. Select the desired file tab, enter a search string in the Text to find field, and click Next or Previous to step through the file from one hit to the next. Toggle on Match case to perform a case-sensitive search.
The information presented in the job monitor dialog box is updated continually as the analysis progresses. If the job fails, the Errors tabbed page appears in front of the other tabbed pages automatically to help you determine the cause of the failure. In addition, an exclamation point appears on the tab if any error or warning messages are output.
If you start monitoring a job and then exit Abaqus/CAE, close the current model database, or open a new model database, Abaqus/CAE will stop updating the job monitor. The job will continue to run; however, the job monitor will not report the status of the job or update the increment information.
If you requested DOF Monitor output on a particular degree of freedom for a particular node, Abaqus/CAE provides another opportunity to monitor the job by plotting the values of the degree of freedom over time. The plot appears in a new viewport that is generated automatically when you submit the job. If the visible part of the canvas is already filled with one or more viewports, the new viewport may be placed on a part of the canvas that is not visible; in this case you should tile or cascade the viewports or enlarge the canvas to bring the viewport into view. (For information on requesting output for a particular degree of freedom for a particular node, see Degree of freedom monitor requests.)
If necessary, you can terminate the analysis job by clicking Kill at the bottom of the job monitor dialog box.