About 2D and 3D Scatter Plot Graphs | ||
| ||
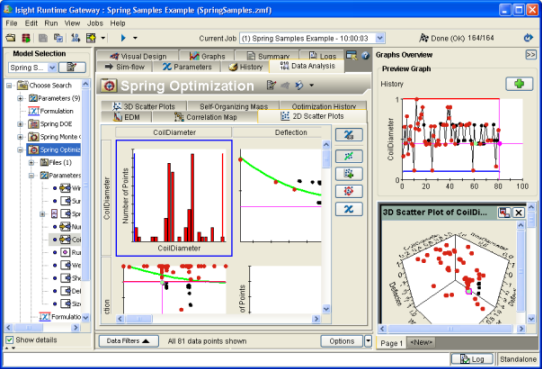
When you execute a model or job, Isight automatically creates 2D and 3D scatter plots and places them on their respective subtabs on the Data Analysis tab. Scatter plots are one of the standard graph types available in Isight (see Standard Graph Types).
The scatter plot graphs that are displayed on the Data Analysis tab are based upon the parameters selected on the EDM subtab. For more information on selecting parameters using the Engineering Data Mining (EDM) tool, see Changing the Parameters Used by the EDM Tool.
By default, all data points found in the database are displayed in all scatter plot graphs; however, you can choose to display only the Pareto solution points (see Changing the Points Displayed in Scatter Plot Graphs).
The following figure shows an example of a 2D scatter plot:

Note:
If your plot appears with a yellow background and a
![]() button in the top left corner, only a limited number
of runs have been included in the graph. For more information, see Using Data Sampling.
button in the top left corner, only a limited number
of runs have been included in the graph. For more information, see Using Data Sampling.