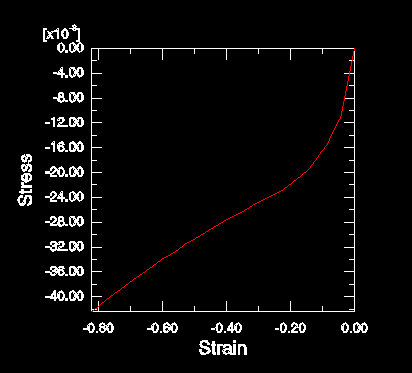
In the XYData container, double-click Stress-Strain. A plot of the stress-strain curve appears in the viewport. Your plot of stress versus strain inherited the customized chart settings from your previous plot. To restore the default chart options, do the following:
- Open the Chart Options dialog box.
- Toggle off Major in both the X Grid Lines and Y Grid Lines fields.
- Click Dismiss.
The plot of stress versus strain appears, as shown in Figure 1. In this figure, the visibility of the plot legend has been suppressed (open the Chart Legend Options dialog box; in the Contents tabbed page, toggle off Show legend). Figure 1. X–Y plot of stress versus strain.

|