X–Y plotting | ||
| ||
Context:
You saved the displacements of the midspan nodes (node set Midspan) in the history portion of the output database file NlSkewPlate.odb for each increment of the simulation. You can use these results to create X–Y plots. In particular, you will plot the vertical displacement history of the nodes located at the edges of the plate midspan.
Click mouse button 3, and select from the menu that appears.
Abaqus reads the data for both curves from the output database file and plots a graph similar to the one shown in Figure 1. (For clarity, the second curve has been changed to a dashed line, and the default grid and legend positions have been changed.)
Figure 1. Midspan displacement history at the edges of the skew plate.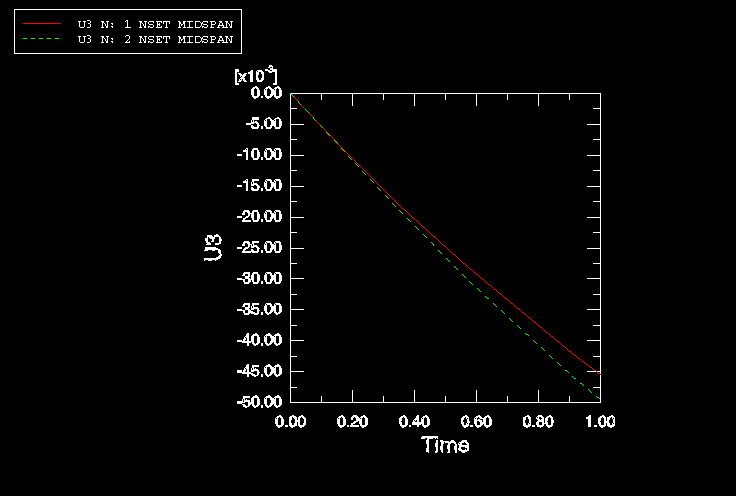
The nonlinear nature of this simulation is clearly seen in these curves: as the analysis progresses, the plate stiffens. In this simulation the increase in the plate stiffness with the deformation is due to membrane effects. Therefore, the resulting peak displacement is less than that predicted by the linear analysis, which did not include this effect.