Context:
You can plot principal values of tensor variables such as stress using
symbol plots. A symbol plot of the principal values of stress yields three
vectors at every integration point, each corresponding to a principal value
oriented along the corresponding principal direction. Compressive values are
indicated by arrows pointing toward the integration point, and tensile values
are indicated by arrows pointing away from the integration point. You can also
plot individual principal values.
From the list of variable types on the left side of the
Field Output toolbar, select Symbol.
From the list of output variables in the center of the toolbar, select
S.
From the list of tensor quantities and components, select
ALL_PRINCIPAL_COMPONENTS as the tensor quantity.
Abaqus/CAE
displays a symbol plot of principal stresses.
From the main menu bar, select
;
or use the Symbol Options
 tool in the toolbox to change the arrow length.
The Symbol Plot Options dialog box appears.
In the Color & Style page, click the
Tensor tab.
Drag the Size slider to select
2 as the arrow length.
Click OK to apply the settings and to close the
dialog box.
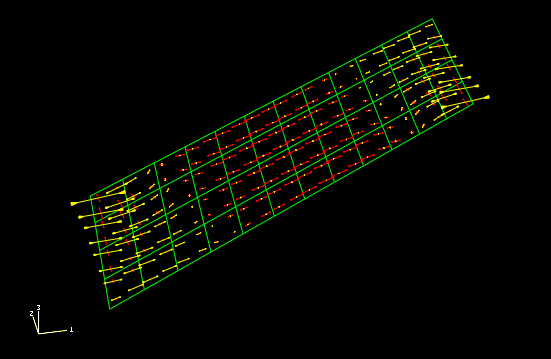
The symbol plot shown in
Figure 2
appears.
Figure 2. Symbol plot of principal stresses on the bottom surface of the
plate.

The principal stresses are displayed at section point 1 by default. To
plot stresses at nondefault section points, select
from the main menu bar to open the
Section Points dialog box.
Select the desired nondefault section point for plotting.
In a complex model, the element edges can obscure the symbol plots. To
suppress the display of the element edges, choose Feature
edges in the Basic tabbed page of the
Common Plot Options dialog box.
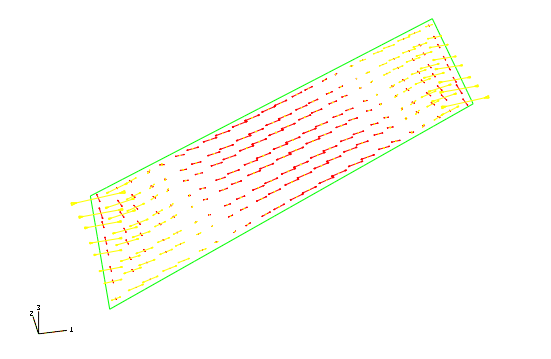
Figure 3
shows a symbol plot of the principal stresses at the default section point with
only feature edges visible.
Figure 3. Symbol plot of principal stresses using feature edges.

![]()

 tool in the toolbox to change the arrow length.

