Displaying and customizing a deformed shape plot | ||
| ||
Context:
From the main menu bar, select
; or use the
 tool in the toolbox.
Abaqus/CAE
displays the deformed model shape, as shown in
Figure 1.
tool in the toolbox.
Abaqus/CAE
displays the deformed model shape, as shown in
Figure 1.
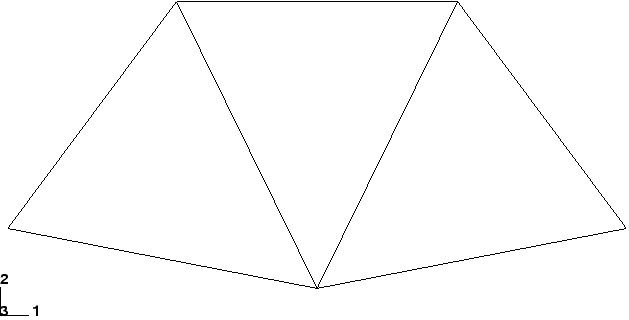
For small-displacement analyses (the default formulation in Abaqus/Standard) the displacements are scaled automatically to ensure that they are clearly visible. The scale factor is displayed in the state block. In this case the displacements have been scaled by a factor of 42.83.
Change the deformation scale factor
From the main menu bar, select ; or use the
 tool in the toolbox.
![]()
Superimpose the undeformed model shape on the deformed model shape
Click the Allow Multiple Plot States
 tool in the toolbox to allow multiple plot states in the
viewport; then click the
tool in the toolbox to allow multiple plot states in the
viewport; then click the
 tool or select
to add the undeformed shape plot to the
existing deformed plot in the viewport.
tool or select
to add the undeformed shape plot to the
existing deformed plot in the viewport.
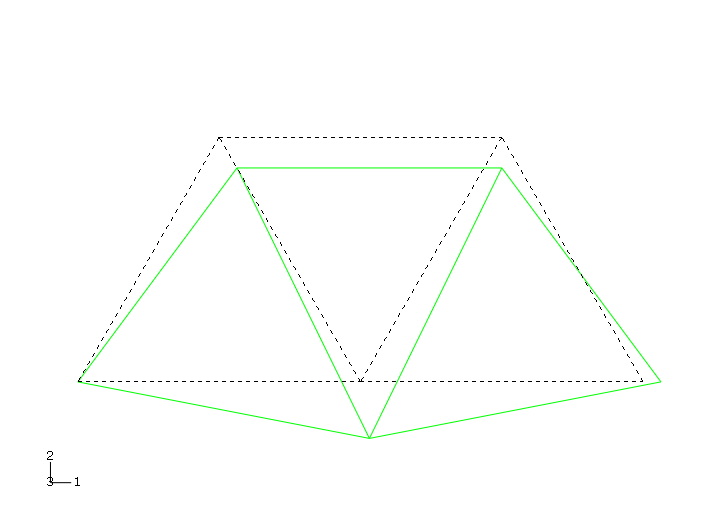
By default, Abaqus/CAE plots the deformed model shape in green and the (superimposed) undeformed model shape in a translucent white.
The plot options for the superimposed image are controlled separately from those of the primary image. From the main menu bar, select ; or use the
 tool in the toolbox to change the edge style of the superimposed
(i.e., undeformed) image.
tool in the toolbox to change the edge style of the superimposed
(i.e., undeformed) image.
Click OK to close the Superimpose Plot Options dialog box and to apply the change.
The plot is shown in Figure 2. The undeformed model shape appears with a dashed edge style.
Figure 2. Undeformed and deformed model shapes.