Viewing the results of your analysis | ||||||||
|
| |||||||
Context:
For the tutorial you will view the undeformed and deformed shapes of the cantilever beam model and create a contour plot.
After you select in the Model Tree, Abaqus/CAE enters the Visualization module, opens Deform.odb, and displays the undeformed shape of the model, as shown in Figure 1.
Figure 1. Undeformed shape plot of model (title block suppressed).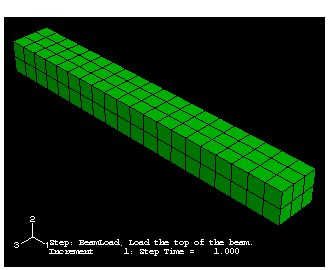
The title block indicates the following:
-
The job description.
-
The output database from which Abaqus/CAE read the data.
-
The release of Abaqus/Standard or Abaqus/Explicit that was used to generate the output database.
-
The date the output database was generated.
The state block indicates the following:
-
The step name and the step description.
-
The increment within the step.
-
The step time.
-
When you are viewing a deformed plot, the deformed variable and the deformation scale factor.
By default, Abaqus/CAE plots the last step and the last frame of your analysis. Buttons that allow you to control which analysis results are plotted are available in the prompt area.
-
Click the auto-fit tool
 so that the entire plot is rescaled to fit in the viewport, as shown in Figure 2.Figure 2. Deformed shape plot of model (title block suppressed).
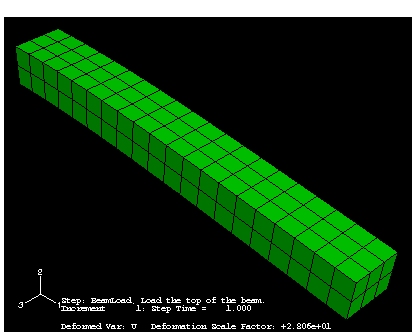
From the main menu bar, select to view a contour plot of the von Mises stress, as shown in Figure 3.
Figure 3. Contour plot of Mises stress (title block suppressed).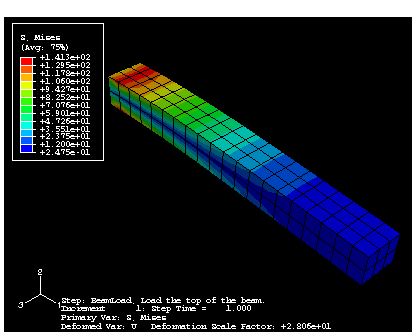
You have now finished this tutorial. Using Additional Techniques to Create and Analyze a Model in Abaqus/CAE, introduces additional techniques to create and analyze a model; for example, you will create and assemble multiple part instances and define contact. Viewing the Output from Your Analysis, covers the capabilities of the Visualization module in more detail.