Reviewing the analysis | ||
| ||
- Damping
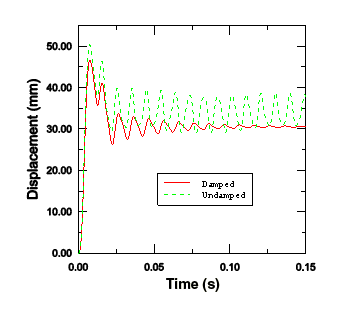
Undamped structures continue to vibrate with constant amplitude. Over the 50 ms of this simulation, the frequency of the oscillation can be seen to be approximately 100 Hz. A constant amplitude vibration is not the response that would be expected in practice since the vibrations in this type of structure would tend to die out over time and effectively disappear after 5–10 oscillations. The energy loss typically occurs by a variety of mechanisms including frictional effects at the supports and damping by the air.
Consequently, we need to consider the presence of damping in the analysis to model this energy loss. The energy dissipated by viscous effects, ALLVD, is nonzero in the analysis, indicating that there is already some damping present. By default, a bulk viscosity damping (discussed in Nonlinear Explicit Dynamics) is always present and is introduced to improve the modeling of high-speed events.
In this shell model only linear damping is present. With the default value the oscillations would eventually die away, but it would take a long time because the bulk viscosity damping is very small. Material damping should be used to introduce a more realistic structural response. Thus, modify the material definition.
To add damping to a material:
In the Model Tree, double-click Steel underneath the Materials container.
In the Edit Material dialog box, select and specify 50 as the value for the mass proportional damping factor, Alpha. Beta is the parameter that controls stiffness proportional damping; at this stage, leave it set to zero.
Click .
The duration of the oscillation of the plate is approximately 30 ms, so we need to increase the analysis period to allow enough time for the vibration to be damped out. Edit the step definition, and increase the time period of step Blast to 150E-3 s.
The results of the damped analysis clearly show the effect of mass proportional damping. Figure 1 shows the displacement history of the central node for both the damped and undamped analyses. (We have extended the analysis time to 150 ms for the undamped model to compare the data more effectively.) The peak response is also reduced due to damping. By the end of the damped analysis the oscillation has decayed to a nearly static condition.
Figure 1. Damped and undamped displacement histories.
- Rate dependence
Some materials, such as mild steel, show an increase in the yield stress with increasing strain rate. In this example the loading rate is high, so strain-rate dependence is likely to be important.
Add rate dependence to your material definition.
To add rate dependence to your metal plasticity material model:
In the Model Tree, double-click Steel underneath the Materials container.
In the Edit Material dialog box, select Plastic from the list of material behaviors.
Select .
In the Suboption Editor that appears, enter a value of 40 for the Multiplier and a value of 5 for the Exponent, and click .
With this definition of rate-dependent behavior, the ratio of the dynamic yield stress to the static yield stress () is given for an equivalent plastic strain rate (), according to the equation , where and are material constants (40 and 5 in this case).
Change the time period of step Blast back to the original value of 50 ms. Create a job named BlastLoadRateDep, and submit the job for analysis. When the analysis is complete, open the output database file BlastLoadRateDep.odb, and postprocess the results.
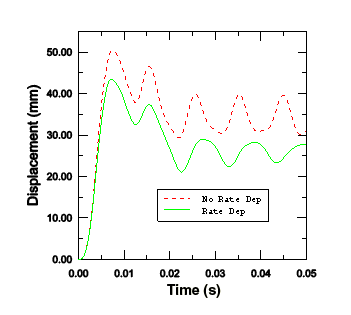
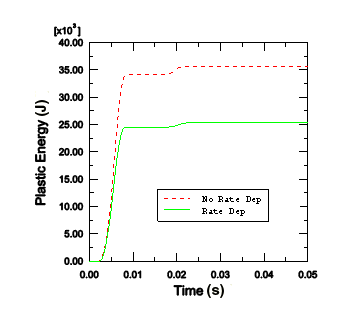
When rate dependence is included, the yield stress effectively increases as the strain rate increases. Therefore, because the elastic modulus is higher than the plastic modulus, we expect a stiffer response in the analysis with rate dependence. Both the displacement history of the central portion of the plate shown in Figure 2 and the history of plastic strain energy shown in Figure 3 confirm that the response is indeed stiffer when rate dependence is included. The results are, of course, sensitive to the material data. In this case the values of and are typical of a mild steel, but more precise data would be required for detailed design analyses.
Figure 2. Displacement of the central node with and without rate dependence. Figure 3. Plastic strain energy with and without rate dependence.