Results data | ||
| ||
- Steps
An Abaqus analysis contains a sequence of one or more analysis steps. Each step is associated with an analysis procedure.
- Frames
Each step contains a sequence of frames, where each increment of the analysis that resulted in output to the output database is called a frame. In a frequency or buckling analysis each eigenmode is stored as a separate frame. Similarly, in a steady-state harmonic response analysis each frequency is stored as a separate frame.
- Field output
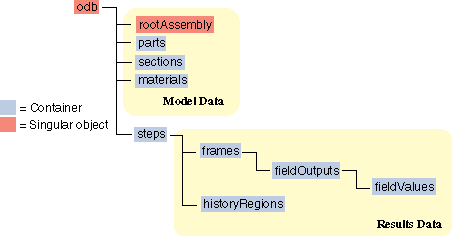
Field output is intended for infrequent requests for a large portion of the model and can be used to generate contour plots, animations, symbol plots, and displaced shape plots in the Visualization module of Abaqus/CAE. You can also use field output to generate an X–Y data plot. Only complete sets of basic variables (for example, all the stress or strain components) can be requested as field output. Field output is composed of a cloud of data values (e.g., stress tensors at each integration point for all elements). Each data value has a location, type, and value. You use the regions defined in the model data, such as an element set, to access subsets of the field output data. Figure 1 shows the field output data object model within an output database.
Figure 1. The field output data object model.
- History output
History output is output defined for a single point or for values calculated for a portion of the model as a whole, such as energy. History output is intended for relatively frequent output requests for small portions of the model and can be displayed in the form of X–Y data plots in the Visualization module of Abaqus/CAE. Individual variables (such as a particular stress component) can be requested.
Depending on the type of output expected, a HistoryRegion object can be defined for one of the following:
a node
an integration point
a region
the whole model
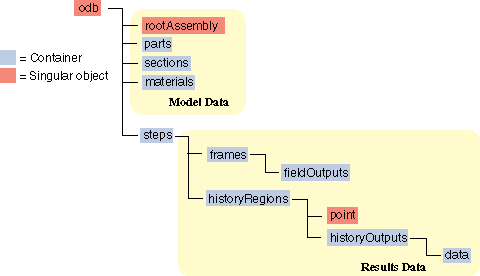
The output from all history requests that relate to a particular point or region is then collected in one HistoryRegion object. Figure 2 shows the history output data object model within an output database.
Figure 2. The history output data.