The example script | ||
| ||
The script does the following:
-
Opens the tutorial output database.
-
Creates variables that refer to the first and second steps in the output database.
-
Creates variables that refer to the last frame of the first and second steps.
-
Creates variables that refer to the displacement field output in the last frame of the first and second steps.
-
Creates variables that refer to the stress field output in the last frame of the first and second steps.
-
Subtracts the displacement field output from the two steps and puts the result in a variable called deltaDisplacement.
-
Subtracts the stress field output from the two steps and puts the result in a variable called deltaStress.
-
Selects deltaDisplacement as the default deformed variable.
-
Selects the von Mises invariant of deltaStress as the default field output variable.
-
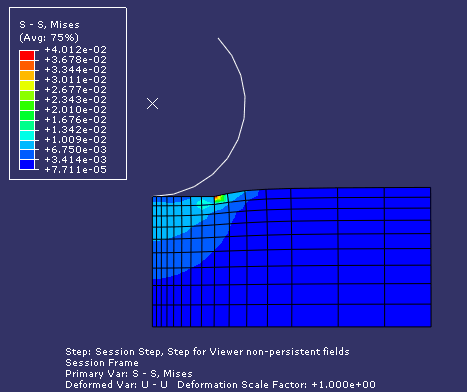
Plots a contour plot of the result.
The resulting contour plot is shown in Figure 1.
Use the following commands to retrieve the script and the output database that is read by the script:
abaqus fetch job=odbExample
abaqus fetch job=viewer_tutorial
The example follows:
"""
odbExample.py

Script to open an output database, superimpose variables
from the last frame of different steps, and display a contour
plot of the result.
"""

from abaqus import *
from abaqusConstants import *
import visualization

myViewport = session.Viewport(name='Superposition example',
    origin=(10, 10), width=150, height=100)

# Open the tutorial output database.

myOdb = visualization.openOdb(path='viewer_tutorial.odb')

# Associate the output database with the viewport.

myViewport.setValues(displayedObject=myOdb)

# Create variables that refer to the first two steps.

firstStep = myOdb.steps['Step-1']
secondStep = myOdb.steps['Step-2']

# Read displacement and stress data from the last frame
# of the first two steps.

frame1 = firstStep.frames[-1]
frame2 = secondStep.frames[-1]

displacement1 = frame1.fieldOutputs['U']
displacement2 = frame2.fieldOutputs['U']

stress1 = frame1.fieldOutputs['S']
stress2 = frame2.fieldOutputs['S']

# Find the added displacement and stress caused by
# the loading in the second step.

deltaDisplacement = displacement2 - displacement1
deltaStress = stress2 - stress1

# Create a Mises stress contour plot of the result.

myViewport.odbDisplay.setDeformedVariable(deltaDisplacement)

myViewport.odbDisplay.setPrimaryVariable(field=deltaStress,
    outputPosition=INTEGRATION_POINT,
    refinement=(INVARIANT, 'Mises'))

myViewport.odbDisplay.display.setValues(plotState=(
                                          CONTOURS_ON_DEF,))