Displaying field output values or discontinuities

For element-based field output variables, such as stress or strain, you can choose to display the field output values themselves or the differences in field output values between adjacent elements. This choice is applicable to line- and banded-type contours, probing at nodal locations, forming display groups and color coding based on result values, or extracting X–Y data along a path.

Related Topics
Understanding how results are computed

Context:

The default is to display Field output values. If you choose to display Discontinuities, the Averaging threshold is not applicable.

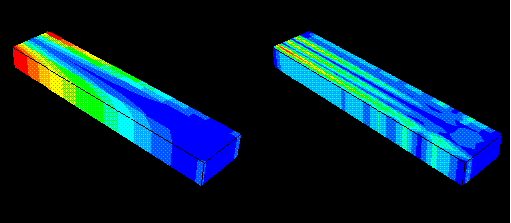
Figure 1 displays a contour plot of field output values on the left and a contour plot of discontinuities on the right.

Figure 1. Contour plots showing field output values and discontinuities in values.

  1. Locate the Quantity to Plot options.

    From the main menu bar, select ResultOptions; then click the Computation tab in the dialog box that appears. The Quantity to Plot options are at the top of the page.

  2. Click Field output or Discontinuities to choose the quantity that you want to plot.

  3. Abaqus displays results in the current viewport according to your specifications.

    By default, your changes are saved for the duration of the session and will affect all subsequent display of results. If you want to retain your changes for subsequent sessions, save them to a file. For more information, see Saving customizations for use in subsequent sessions.