What is an X–Y data object, and what is an X–Y plot? | ||
| ||
By default, the X–Y data objects you save are retained for the duration of the session only. If you want to make X–Y data objects available for subsequent sessions, you can save them to an XML file, to the model database, or to an output database using the option; or you can copy them to an output database file using the button in the XY Data Manager.
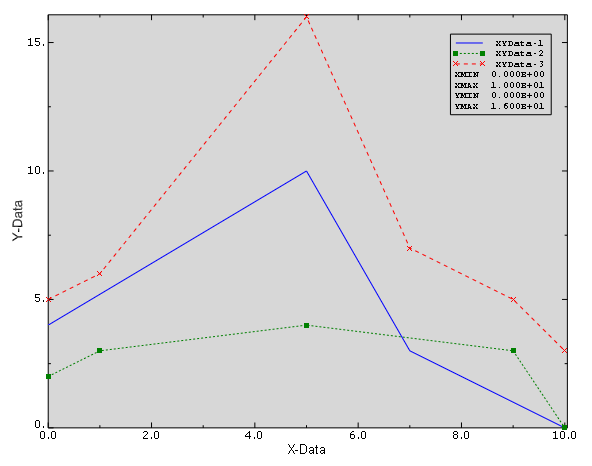
Abaqus/CAE can display X–Y data in the form of an X–Y plot. An X–Y plot is a two-dimensional graph of one variable versus another. Examples of X–Y plots include temperature versus time, load versus displacement, and stress versus strain. You can display multiple X–Y data objects in one X–Y plot, and you can use the customization options to control the appearance of each data object and the overall appearance of the components of an X–Y plot. These components include the axes; the legend, which is a key that associates each X–Y curve in the plot with the X–Y data object it represents; and the X–Y curves. Figure 1 shows an X–Y plot displaying three X–Y data objects.