Understanding result value averaging | ||
| ||
line- or banded-type contours,
probing at nodal locations,
forming a display group or color coding based on result values,
extracting X–Y data from fields,
extracting X–Y data along a path, or
generating reports for field data.
The display of node-based field output variables (such as displacement), quilt contour plots, and plots of discontinuities does not involve value averaging.
Extrapolated output database values at nodes common to two or more elements are averaged conditionally. You can use the following options to control the extent to which Abaqus/CAE averages the values at the nodes:
Select result regions and choose whether averaging takes place across region boundaries.
Choose whether shell and membrane feature edges are treated as region boundaries for averaging.
Include or exclude contributions from elements that are not displayed.
Choose whether invariants are computed and components are extracted before or after averaging.
Select a threshold value to control averaging based on the difference between the contributing element values (this option is available only if you choose to calculate invariants before averaging).
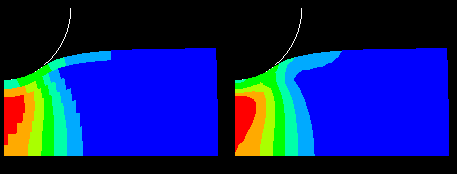
Abaqus/CAE averages values at nodes common to two or more elements when the contributing elements lie in the same result region. The default result regions are the same regions defined when you assign sections to your model; you can also define custom result regions using saved element sets or display groups. You can choose whether or not Abaqus/CAE averages values at nodes common to two or more result regions. You can suppress averaging across regions (use the region boundaries) to emphasize any discontinuities at region boundaries, or you can request averaging across regions (ignore region boundaries) to produce a more continuous effect. For example, Figure 1 shows a contour plot using region boundaries on the left and averaging across region boundaries on the right.
If you choose to average across regions, the extent to which values are averaged is controlled by the threshold that you specify as follows:
If the relative nodal variation for each node included in the plot is less than your averaging threshold, values of contributing elements are averaged at that node. If the relative nodal variation exceeds your setting, the values are not averaged. When you decide to average across regions, the averaging threshold is considered in relation to the variation of values across the whole model unless you limit averaging to the displayed elements. Setting a high averaging threshold would allow you to smooth out all but the most extreme discontinuities relative to results across your model or all displayed results.
If you choose not to average across regions, the extent to which values are averaged at nodes within each region is controlled by the averaging threshold that you specify as follows:
If the relative nodal variation for each node included in the plot is less than your averaging threshold, values of contributing elements are averaged at that node. If the relative nodal variation exceeds your setting, the values are not averaged. When you suppress averaging across regions, the averaging threshold is considered in relation to the variation of values within each region rather than across the whole model or all displayed results.
The lower the averaging threshold you apply, the more the displayed values depict the individual element results. Conversely, a higher averaging threshold produces a smoother effect with fewer noticeable discontinuities from element to element.
When using threshold-based averaging in conjunction with the extraction of X–Y data from element-based fields, you might want to adjust the threshold value. The element region used when extracting X–Y data is reduced to include only the elements that are attached to the specified nodes.
If you choose to compute invariants and extract components after averaging,
Abaqus/CAE does not apply the averaging threshold;
tensors are transformed to an average orientation at each node prior to averaging; and
result regions, if used, must contain compatible elements.
For more information, see Understanding how results are computed.
Select to locate the options that affect averaging. Controlling result averaging, and Controlling computations at region boundaries, provide details on using the averaging options.