Evaluating hyperelastic and viscoelastic material behavior | ||
| ||
To initiate the evaluation procedure, select from the main menu bar. Alternatively, you can select the material of interest in the Material Manager and then click . The Evaluate Material dialog box appears in which you can specify how you want Abaqus/CAE to perform the standard tests. For detailed instructions on evaluating hyperelastic material behavior, see Displaying X–Y plots of hyperelastic material behavior. For detailed instructions on evaluating viscoelastic material behavior, see Displaying X–Y plots of viscoelastic material behavior.
Note:
The material evaluation procedure generates jobs with the same names as the materials; therefore, these material names must adhere to the same rules as job names (see Using basic dialog box components, for more information on naming objects).
The Evaluate option is particularly useful in the following scenarios:
- Comparing test data with the behavior predicted by a particular strain energy potential
When you define a hyperelastic material using experimental data, you also specify the strain energy potential that you want to apply to the data. Abaqus uses the experimental data to calculate the coefficients necessary for the specified strain energy potential. However, it is important to verify that an acceptable correlation exists between the behavior predicted by the material definition and the experimental data.
You can use the Evaluate option to calculate the material response based on the experimental data using the strain energy potential that you have specified in the material definition. When the tests are complete, Abaqus/CAE enters the Visualization module and displays X–Y plots of the test results. Each plot includes the experimental data and a curve for each evaluated strain energy potential. Abaqus/CAE also opens a dialog box containing the stability limits and coefficients for each strain energy potential.
For example, the X–Y plot in Figure 1 shows the results of a planar test using the Ogden N=3 strain energy potential.
Figure 1. Results of a planar test.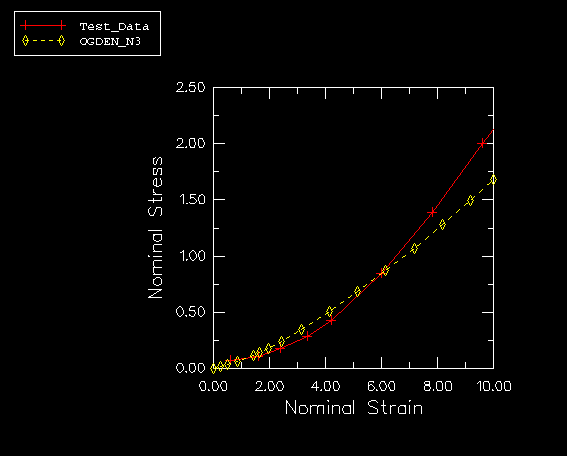
In addition, the following information is reported to the data (.dat) file:
The coefficients calculated for the strain energy potential.
Any material instabilities that were detected during the tests.
The path to the data (.dat) file appears in the message area of the Abaqus/CAE main window once the analysis has completed successfully.
- Evaluating multiple strain energy potentials
If you are defining a hyperelastic material using experimental data and you are unsure which strain energy potential to specify, you can select Unknown from the Strain energy potential list in the material editor. You can then use the Evaluate option to perform standard tests with the experimental data using multiple strain energy potentials.
When the tests are complete, Abaqus/CAE enters the Visualization module and displays an X–Y plot for each test and a dialog box containing the stability limits and coefficients for each strain energy potential. Each plot includes the experimental data and a curve for each evaluated strain energy potential. You can visually compare the strain energy potential curves and the experimental data curve and select the strain energy potential that provides the best fit.
Once you have determined which strain energy potential provides the best fit with the experimental data, you must return to the material editor in the Property module and change the Strain energy potential selection from Unknown to the strain energy potential that you have chosen.
- Viewing behavior predicted by coefficients
If you have acquired coefficients for a particular strain energy potential (either by evaluating one or more hyperelastic strain energy potentials, as described above, or from another source), you may want to verify that the behavior predicted by the strain energy potential acceptably matches your experimental data or meets other criteria.
You can use the Evaluate option to plot a curve of the strain energy potential using the coefficients you provided in the material definition. If the material definition also includes experimental data, a curve for that data also appears in the plot.
- Viewing response curves for viscoelastic materials
If you have shear or volumetric test results, you may want to verify that the creep and relaxation behavior predicted by Abaqus acceptably matches your experimental data or meets other criteria. Likewise, if you have frequency data, you may want to verify that the predicted storage and loss components of the shear and bulk moduli match your data.
You can use the Evaluate option to plot curves using the coefficients you provided in the material definition. If the material definition includes experimental data, curves for those data also appear in the plots. The types of curves produced depend on the material definition. For viscoelastic materials defined using a Prony series, creep test data, or relaxation test data for time, you can produce creep and relaxation plots versus time. For viscoelastic materials defined using frequency data for time, you can produce plots of the storage and loss components of the shear and bulk moduli versus a logarithmic scale of frequencies.
- Adjusting material data
If you are unsatisfied with the fit between the test data and the behavior predicted by the material, you can return to the Property module and adjust the test data and then evaluate the material again. You can repeat this process until you are satisfied with the material behavior. In some cases it may be possible to use this approach to optimize the coefficient values included in a hyperelastic material definition. For more information, see “Improving the accuracy and stability of the test data fit,” in Hyperelastic behavior of rubberlike materials.
For detailed instructions on evaluating materials, see the following sections :
For more information on the strain energy potentials available in Abaqus, see “Strain energy potentials,” in Hyperelastic behavior of rubberlike materials.