Understanding job diagnostics | ||
| ||
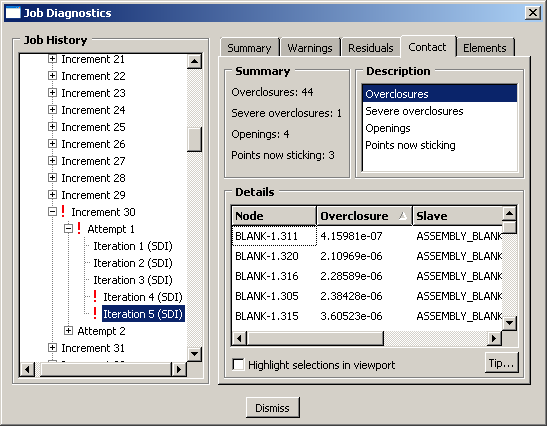
For an Abaqus/Standard analysis, diagnostic information is available for the job and for each step, increment, attempt, and iteration. Figure 1 shows contact diagnostics for an Abaqus/Standard analysis iteration. You can choose the type of contact information that you want to view, and you can select a column to sort the table data.

For an Abaqus/Explicit analysis, diagnostic information is available for the job and for each step. Because of the large number of increments in a typical Abaqus/Explicit analysis, diagnostic information is recorded for summary (heartbeat) increments and for any other increments in which diagnostic information is generated. The interval between summary increments depends on the CPU time and the amount of output specified in the analysis. The diagnostic data are written to the status file and to the output database.
You can use the Job Diagnostics dialog box to determine when an analysis ended and whether any warnings were issued. If warnings were issued during the job, you can view the warnings and assess whether your results may have been affected. The Job Diagnostics dialog box also provides more detailed information to explain the meanings of or possible causes for most warnings and errors and, if the warnings are associated with nodes or elements, to help you locate them on the model in the viewport.
You can view diagnostic information during an analysis or after it ends. However, the Job Diagnostics dialog box does not update automatically. If you view diagnostic information while an analysis is running, you must close and then reopen the output database as the analysis progresses to display any new diagnostic information.