Understanding prescribed condition symbol type, color, and size | ||||||
|
| |||||
the type of prescribed condition that the symbols represent,
the degrees of freedom to which you apply the prescribed condition, and
the spatial variation of the prescribed condition (for analytical field distributions).
Refer to Symbols used to represent prescribed conditions, for summaries of the significance of the symbol types and colors.
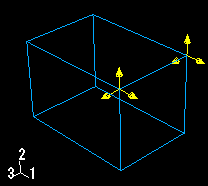
For example, Figure 1 displays a concentrated force applied to vertices. All of the arrows that represent the different components of the concentrated force are yellow.
On the other hand, Figure 2 shows a Velocity/Angular Velocity boundary condition that is applied to both translational and rotational degrees of freedom. The sandy brown arrows represent components of the boundary condition that are applied to translational degrees of freedom. The magenta arrows represent components of the boundary condition that are applied to rotational degrees of freedom.
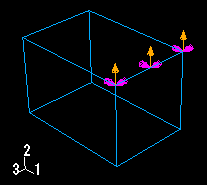
Note:
When a boundary condition fixes a degree of freedom in place, the arrow representing that component lacks a stem.
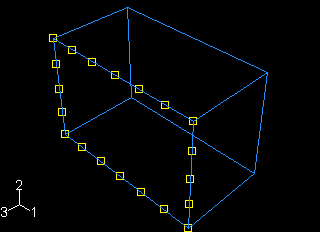
Figure 3 displays a uniform temperature field applied to a face.
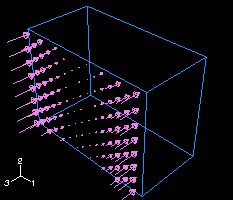
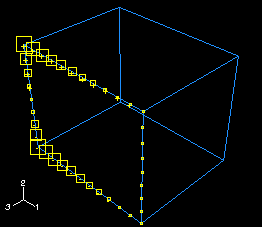
In general, the size of the symbols is uniform and unrelated to the magnitude of the prescribed condition. For prescribed conditions that use analytical field distributions, the symbols are scaled based on the analytical field value. Figure 4 shows a pressure load that uses an analytical field to specify a spatially varying magnitude.
In addition, for symbols other than arrows, a plus sign (+) or a minus sign (−) is displayed inside each symbol to indicate whether the magnitude of the prescribed condition is positive or negative at that location.Figure 5 shows a temperature boundary condition. For clarity, the symbol size has been increased.
For information on controlling symbol size and scaling, see Controlling the display of attributes.
In some circumstances Abaqus/CAE displays scaled-down symbols for prescribed conditions, such as when a specified prescribed condition has no effect on the analysis or when an analytical field evaluates to zero for a portion of its region. These scaled-down symbols are noticeably smaller than the default symbol size. For example, if you specify a shear surface traction load with a direction vector normal to the surface, Abaqus/CAE cannot apply this type of load normal to the reference surface and displays very small arrow symbols to represent the load in the viewport.