About contour plotting | ||
| ||
Line, banded, quilt-type, and isosurface contours are shown in Figure 1.

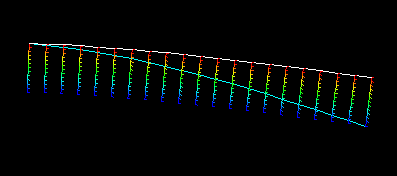
As with other elements, contour lines for line-shaped elements (beams, one-dimensional elements, gasket link elements, and three-dimensional line gasket elements, as well as two-dimensional contact surfaces) are plotted along the elements by default. Line-type contour plots are not recommended for line-shaped elements. Tick mark contour plotting provides an alternative means of visualizing contours on beams and other line-shaped elements. The contour is displayed as a curve plotted between two sets of lines normal to the elements, as shown in Figure 2. The contour level is indicated by “tick marks” on these normal lines.
The key to interpreting a contour plot is the plot legend. The legend indicates the correspondence between contour values and contour colors.
By default, Abaqus/CAE evenly divides the difference between the minimum and maximum values in the legend into 12 intervals. You can change the number of intervals if necessary. A color is associated with each interval. For a line-type or isosurface-type contour plot each colored line or surface corresponds to a set of locations in the model for which the field output variable has the value shown in the legend. For a banded contour plot each colored contour band corresponds to a range of values within the bounds indicated by the legend. For a quilt contour plot each colored element face corresponds to a single value within the bounds indicated by the legend for that color. For a tick mark contour plot each colored tick mark corresponds to a single value indicated by the legend.
Abaqus/CAE follows a different convention for contour plots of contact status (CSTATUS). This variable describes whether individual nodes on the master and slave surfaces are in contact and, if so, whether the surfaces are sticking or slipping at that point. Because three settings are available to describe the contact status at each node—sticking, slipping, or open—Abaqus/CAE displays contact status data using three contour intervals and renders the contour plot by coloring the region around a node according to its contact status.
The components of connector vector output are resolved with respect to different coordinate systems depending on whether the output requested is field output or history output. See Displaying connectors and connector output in the Visualization module, for how to interpret the vector component values in field plots.
To learn how to produce a contour plot, see Producing a contour plot.