Viewing output from Eulerian analyses | ||
| ||
Special steps must be taken in the Visualization module of Abaqus/CAE to view material instances within an Eulerian part. By default, Abaqus/CAE displays the full Eulerian part mesh in both undeformed and deformed plot states with no indication of the material instance boundaries within the mesh.
Visualization of material instances is based on output variable EVF, the Eulerian material volume fraction. Output variable EVF measures the amount of a particular material instance within an element as a relative fraction. An EVF value of one indicates that the element is completely filled with the specified material instance; an EVF value of zero indicates that the element is completely devoid of the specified material instance.
For elements that are partially filled or filled with multiple materials, Abaqus estimates a simple boundary between materials by interpolating the EVF values in adjacent elements. These simple boundaries may be slightly discontinuous across elements. To improve display of Eulerian materials, you should instruct Abaqus/CAE either to use a results averaging threshold of 100% or to compute scalars after averaging results; Abaqus/CAE remaps the material boundaries so they appear smooth and continuous across elements. For more information about results averaging, see Controlling result averaging; for a more detailed discussion of how Abaqus calculates Eulerian material boundaries, see Material interfaces.
Output variable EVF is written to the output database if you request the Preselected defaults in the field output request editor (see Modifying field output requests). When you request output for EVF, Abaqus creates a separate material volume fraction output variable for each material instance in the model; for example, EVF_WATER is the volume fraction for the material instance named Water. An output variable named EVF_VOID is created to measure the volume fraction of empty regions in an Eulerian part.
The following techniques can be used in the Visualization module to view the initial and deformed states of material in an Eulerian part:
- Contour plots
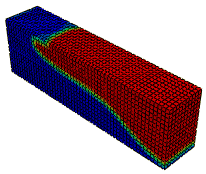
A contour plot of output variable EVF for a particular material instance allows you to visualize which areas of the model are occupied by the material during the analysis. Areas occupied by the material (EVF equal to one) appear as a uniform color from the top of the contour spectrum, while areas unoccupied by the material appear as a different color from the bottom of the contour spectrum; depending on your contour plot settings, the boundary of the material instance appears in a range of colors as EVF transitions from one to zero (see Figure 1).
Figure 1. Contour plot of an Eulerian material instance.
Contour plots are of limited usefulness when visualizing Eulerian materials because the contours appear on the faces of the Eulerian parts. You cannot effectively visualize material volume fraction contours on the interior of Eulerian parts.
For further details on using contour plots in the Visualization module, see Contouring analysis results.”
- View cuts
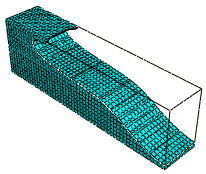
To visualize the behavior of a material on the interior of an Eulerian part, activate a view cut along an isosurface of the EVF variable associated with that material instance. Abaqus/CAE automatically creates these isosurface view cuts for each material instance in the model, but you must activate them in the View Cut Manager. Using the view cut options, you can eliminate portions of the part that do not include a selected material by rendering them unfilled, rendering them translucent, or removing them from the display (see Figure 2).
Figure 2. View cut along an Eulerian material instance isosurface.
If your Eulerian part includes regions without a material assignment, it may be helpful to activate an isosurface view cut based on the EVF_VOID output variable. By cutting away all regions in which EVF_VOID is greater than 0.5, you are able to see the shape of materials within the part.
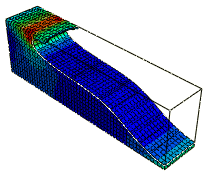
After activating an isosurface view cut based on the EVF variable, you can change the primary field output variable without affecting the view cut. This enables you to visualize results contours along the boundaries of material instances instead of on Eulerian part faces (see Figure 3).
Figure 3. Contour plot of stresses in a cut Eulerian part.
Isosurface view cuts based on output variable EVF do not affect Lagrangian part instances in a coupled Eulerian-Lagrangian model. The Lagrangian parts remain visible when the cut is active. Therefore, this technique is useful for visualizing the interaction between a Lagrangian part and an Eulerian material instance.
For further details on using view cuts in the Visualization module, see Cutting through a model.”
- Combining view cuts and contour plots
In an Eulerian part that includes three material instances, you can use a combination of view cuts and contour plots to distinguish material instances in the undeformed and deformed model states. First, use an isosurface view cut to remove one of the material instances from the display, as discussed above. Then, create a contour plot of output variable EVF for one of the remaining material instances. The resulting colors in the model distinguish one material from the other. To produce a more defined boundary between the materials, you can reduce the number of contour intervals to two.
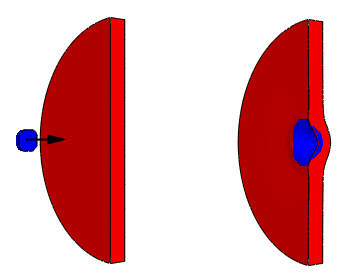
For example, Figure 4 depicts an Eulerian model of a lead projectile impacting a brass plate. The void regions of the Eulerian part are cut away. A two-interval contour plot is applied, rendering the brass in one color and the lead (i.e., not brass) in another color. The resulting plot offers a useful generalization of the deformed shape of the projectile and plate.
Figure 4. A contour plot is used to distinguished two Eulerian materials in a projectile impact analysis.
Currently there is no way to visually distinguish more than three Eulerian material instances simultaneously using Abaqus/CAE.
- Color coding
Color coding cannot be used to visualize material behavior in Eulerian parts. The color coding tool in Abaqus/CAE does not recognize Eulerian section or material assignments. Color coding based on element sets is also ineffective for deformed shape plots because the Eulerian elements do not deform with the material.
However, in coupled Eulerian-Lagrangian models, color coding can distinguish between Eulerian and Lagrangian part instances or Eulerian and Lagrangian element types. When used with the visualization techniques discussed above, color coding can be helpful in distinguishing Lagrangian bodies from Eulerian materials in a model.
For further details on applying color coding to a model, see Color coding geometry and mesh elements.”
- Display groups
Certain types of coupled Eulerian-Lagrangian models involve a single Eulerian material instance throughout the Eulerian part; for example, a Lagrangian penetrator moving through a uniform Eulerian material. In these analyses the deformation of the Eulerian material is not as important as the interaction between the Eulerian material and the Lagrangian body. You can use a display group to remove the Eulerian elements from the display and visualize results (such as contact pressure or stress) on only the Lagrangian body.
For further details on using display groups, see Using display groups to display subsets of your model.”