About the Runtime Gateway Layout | ||
| ||
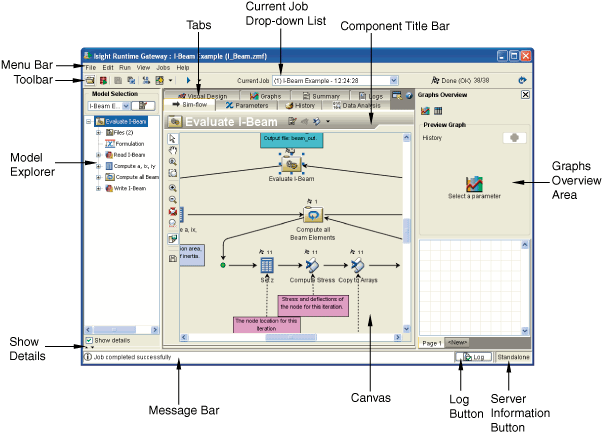
The following figure shows the Isight Runtime Gateway with the main areas labeled:
Use these areas to:
| Menu bar | Build and manipulate a model. For a complete list of menu options, see Runtime Gateway Menu Options. |
| Toolbar | Open models, save models, access the Job Database interface, load different jobs, and execute models. For more information, see Runtime Gateway Toolbar Buttons. |
| Model Explorer | View the components that make up your model. You can use this area to switch between components. For example, when you are viewing the Parameters tab, you can change which component’s parameters you are currently viewing using the model explorer. |
| Canvas located on the Sim-flow and Dataflow tabs) | Display a graphic version of your model simulation process flow and dataflow. |
| Show Details | Display parameters and files for the component currently selected in the model explorer. |
| Tabs | The tabs available in the Runtime Gateway
are different from those in the Design Gateway. The following tabs are available:
|
| Current Job | Switch between the jobs associated with the currently selected model. |
| Component Title Bar | View the name of the currently selected component and to access buttons for editing the component or working with approximations for the component. |
| Graphs Overview area | Automatically generate visuals based on parameters you select and to view any visuals created in the Design Gateway or Runtime Gateway. Graphs and tables created in this area are also added to the Graphs tab. For more information, see Viewing and Analyzing Results. |
| Message Bar | View error messages from model execution and other status information. |
| Run Number Bar | Scroll through the graph information based on individual run numbers. |
| Log Button | Open the Log Viewer, which allows you to view the Design Gateway log file. For more information, see Validating a Model and Accessing the Log File. |
| Server Information Button | View connection information if you are connected to the SIMULIA Execution Engine environment. If you are using Isight in Standalone mode, you cannot click this button; it is for information purposes only. For more information, see Viewing SIMULIA Execution Engine Connection Information. |
 appears above each component when it has executed successfully.
Options on the
appears above each component when it has executed successfully.
Options on the