Postprocessing with Tosca Extension for ANSYS® Workbench | ||
| ||
Display Topology Optimization Result
To display a topology optimization result correctly in the Mechanical application, make sure that the correct Geometry option in the upper toolbar is activated.
- The following table shows the results of the geometry view options:
Geometry view option
leads to
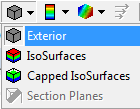
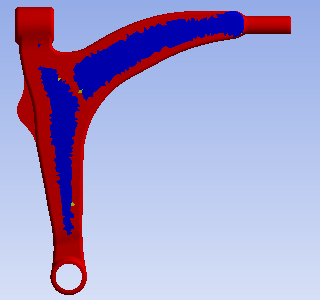
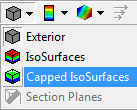
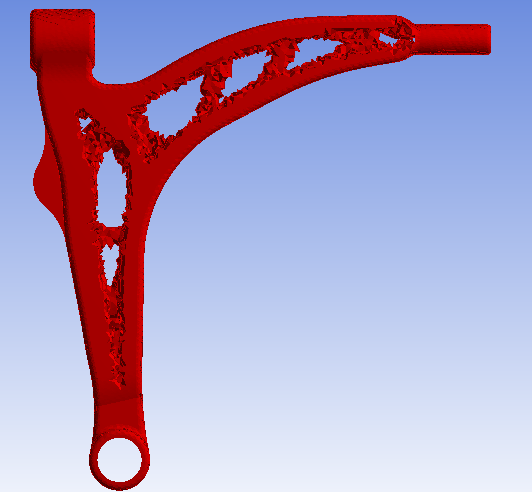

With the option Capped IsoSurfaces it depends on the elements’ density whether they are displayed or not. This limit density (elements above or below are displayed) is adjustable.
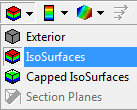
With IsoSurfaces activated, no result will be displayed.
![]()
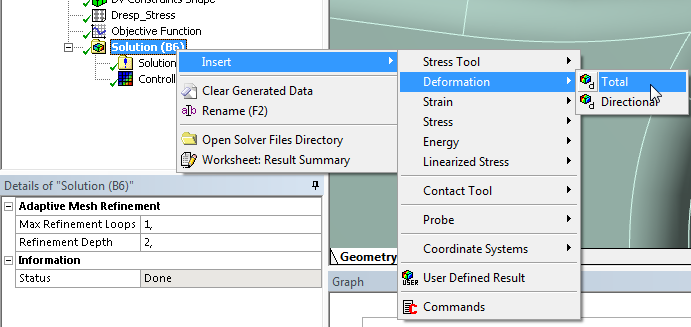
Display Shape Optimization Result
Select Insert > Deformation > Total as shown in the following figure.
Note: This does NOT refer to the total deformation of the component subject to the different load case of the static structural analysis.
![]()
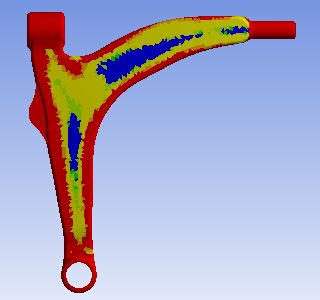
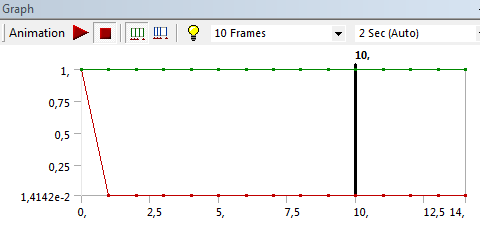
Display Iteration Animation
The Graph window in the Mechanical application provides an overview of the optimization steps. It’s either possible to have a look at each single iteration or to show a little animation from the beginning until the end of the optimization run.
For an animation it is possible to use the Play and Stop button or regulate animation speed. All required buttons can be found in the Graph window.
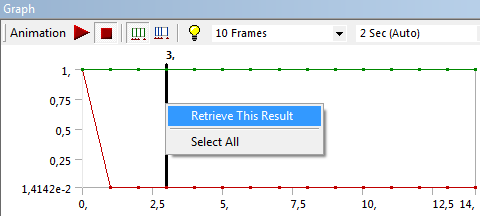
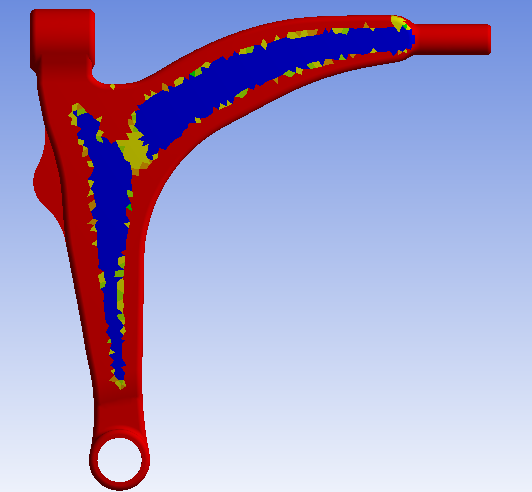
For shape optimization, result animation can be started analogously.
![]()
Open Result Files
A SIMULIA Tosca Structure optimization run saves a lot of data in either the saving directory or a temporary directory.
- To find the working directory, right-click on the Solution
item within the Tree Outline and select Open
Solver Files Directory as shown in the following figure:
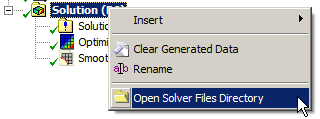
In the folder you find solution data files, the tosca.par file, a vtfx file for visualization with Tosca Structure.view and much more information.