Logging | ||
| ||
Logging is always done to the command shell and to the file <jobname>/TOSCA.OUT-file. The following levels can be used.
| Level | Comment |
|---|---|
| WARNING | (Not recommended) Only WARNINGs and ERRORs are printed. |
| NOTICE | Default output to STDOUT. Only the most important logging. |
| INFO | Default output to logfile TOSCA.OUT. |
| DEBUG | Very verbose output, mostly for support. |
| TRACE | (Not recommended) Extremely verbose, major performance los, only for developers. |
Using the command line option --stderr the errors are written on STDERR as well. This concerns the output for messages with the following log-levels:
  ERROR
  FATAL
  CRITICAL.
If this option is used and the stderr is written to stdout there will be double output for these messages.
TOSCA.OUT
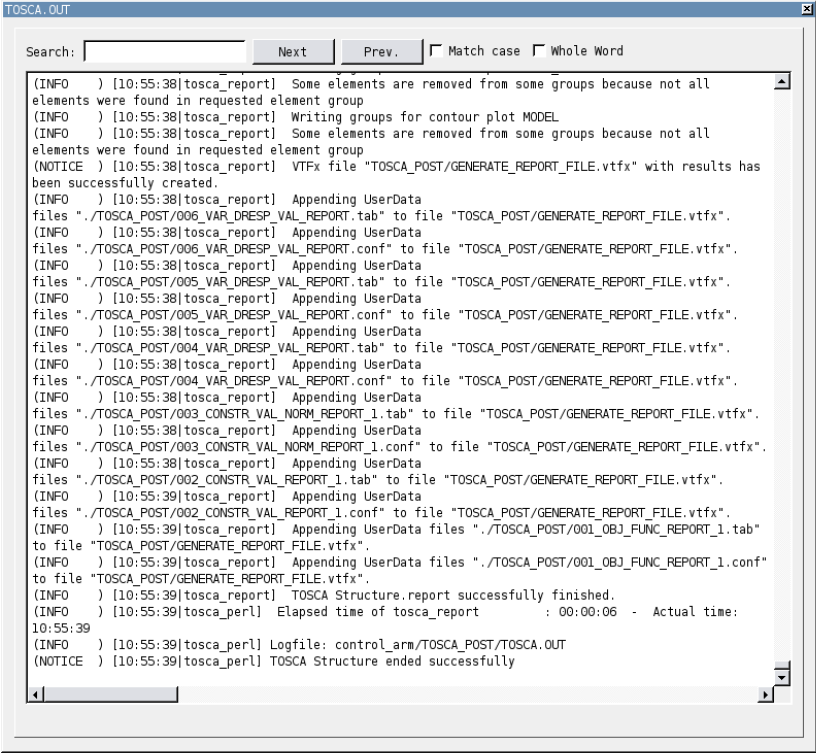
The logfile TOSCA.OUT is the main logfile of Tosca Structure. The logfile is at best viewed in a text editor that uses a fixed width font, e.g. Courier New. The structure of the logging lines is:
(<log tag>)[<teime stamp>|<executable>]<message>
Where:
| <log tag> | =CRITICAL
=ERROR =WARNING =NOTICE =DEBUG =TRACE |
| <time stamp> | Current time in format HH:MM:SS (Hours, Minutes, Seconds). |
| <executable> | Name of the executable that wrote the logging message. |
| Log-tags | Interpretation |
|---|---|
| CRITICAL | A critical error has occurred within the program. Please contact support and explain |
| ERROR | An error has occurred in execution of optimization system and the user should be able to make changes in optimization definition or finite element model to correct the problem. Please also take note of previous warnings |
| WARNING | A warning alerts the user that a problem has been identified, but the optimization system continuous. |
| NOTICE | Very general, important information, e.g. Starting Tosca Structure optimization module - design cycle 6 |
| INFO | Information for the user. |
| DEBUG | Very verbose output, mostly for support. Debug messages are not printed to TOSCA.OUT using default settings. To enable debug output in TOSCA.OUT add --loglevel debug to commandline. |
| TRACE | Extremely verbose output where a major performance los is to be expected. Only for developers. |
An example of TOSCA.OUT using Tosca ANSA® environment and the TOSCA.OUT logfile viewer is shown below.
 |
![]()
Special Logfiles
Beside TOSCA.OUT a few other logfiles can be useful for trouble shooting special problems:
| Logfile | Comment |
|---|---|
| authorization.log | Logging from Tosca Structure’s authorization module tosca_server is written to this file. In case of licensing/authorization problems please look into this file for details. |
| signal.log | This logfile will only have a content if the user interrupts the optimization process with a SIGNAL, typically by pressing Ctrl-C in the command prompt. Tosca Structure will then kill the running subprocess, optionally using a script defined by the setting $killscripts. See CONFIG for details. |
| TOSCA_post.OUT | This logfile is generated when using the commandline flags --smooth or -- report. This enables the user to generate SMOOTH or REPORT results during a running optimization. |
![]()
Viewing TOSCA.OUT Using Tosca ANSA® environment
In Tosca ANSA® environment you see the logging to the so-called STDOUT which means the same as when you would have started SIMULIA Tosca Structure in a command shell.
Adding a TOSCA.OUT item in Tosca ANSA® environment is shown in following figure:
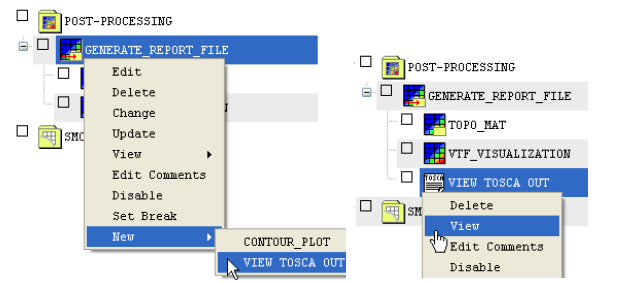 |
Request DEBUG output level to TOSCA.OUT is possible at the following Items:
- Right-click the item and select Edit.
- Change the LOGLEVEL to either INFO or DEBUG.
![]()
Viewing TOSCA.OUT Using Tosca Structure.gui
- To view TOSCA.OUT in Tosca Structure.gui select Start Tosca Structure as Module.
- Select View TOSCA.OUT.
This procedure and also the request of logging on debug level are shown in the following figure:
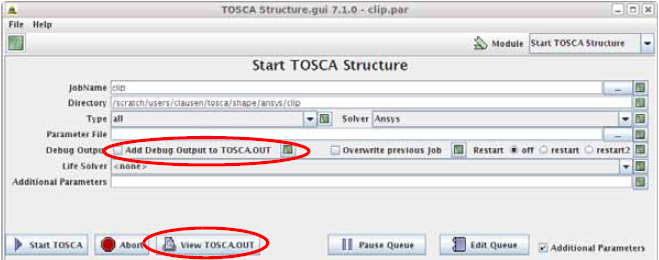 |
To add debugging output in TOSCA.OUT, activate the check-box Debug Output.
![]()
Viewing TOSCA.OUT Using Tosca Extension for ANSYS® WB
Viewing TOSCA.OUT in Tosca Extension for ANSYS® WB is possible in two ways:
- The output can be displayed live during the optimization by
selecting Solution Information in the Outline Tree as shown in the following figure:
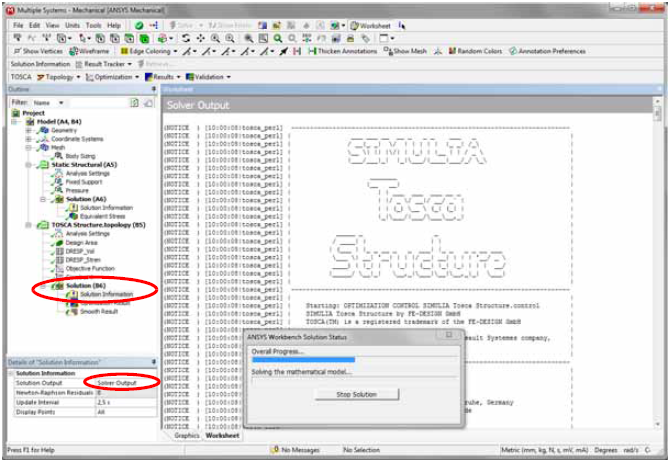
- Alternatively, it’s possible to open the TOSCA.out file itself. Right-click on Solution in the Outline Tree and choose Open Solver Files
Directory, see the following figure.
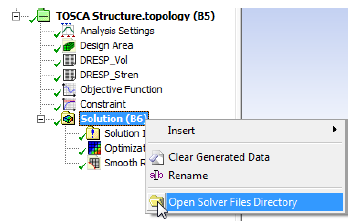
The logfile is located in \tosca\TOSCA.out. The loglevel can be changed in the Analysis Settings.
![]()
Changing Logging Using the Command Shell
To change loglevel to logfile TOSCA.OUT use the following commandline parameter:
tosca --loglevel <new_level> ...
To increase the amount of output to the command shell set the parameter:
tosca --loglevel_stdout <new_loglevel>
| Important:
Note that --loglevel must be equal or more verbose than --loglevel_stdout. To separate stderr from stdout: tosca --stderr |
The following example demonstrates how to increase loglevel to INFO on the command shell and DEBUG output into the logfile TOSCA.OUT:
tosca --loglevel_stdout INFO --loglevel DEBUG ...
![]()
Tips and Tricks Viewing TOSCA.OUT
| Topic | Tips and Tricks |
|---|---|
| Finding errors | Search for the word (ERROR and make sure your editor has not activated regular expressions. This search should always be done from the beginning of the logfile because the first printed error message is usually of greatest importance. |
| Runtime |
You can view the runtime or elapsed time of each executable in a Tosca
Structure run by searching for the keyword Elapsed:
(INFO ) [13:20:22|tosca_perl] Elapsed time of fem_include
: 00:00:00 - Actual time: 13:20:22
(INFO ) [13:20:24|tosca_perl] Elapsed time of fem2onf
: 00:00:02 - Actual time: 13:20:24
(INFO ) [13:20:29|tosca_perl] Elapsed time of tosca_prep
: 00:00:05 - Actual time: 13:20:29
(INFO ) [13:20:31|tosca_perl] Elapsed time of fem_modif
: 00:00:02 - Actual time: 13:20:31
(INFO ) [13:21:57|tosca_perl] Elapsed time of abaqus
: 00:01:26 - Actual time: 13:21:57
(INFO ) [13:21:59|tosca_perl] Elapsed time of odb2vtm
: 00:00:02 - Actual time: 13:21:59
(INFO ) [13:22:03|tosca_perl] Elapsed time of tosca_opt
: 00:00:04 - Actual time: 13:22:03
The time format is in HH:MM:SS. In this case we see that Abaqus has run 1 minute and 26 seconds, whereas the optimization module, tosca_opt, only spent 4 seconds. |
| How is my FE-solver called? |
All calls of executables are written in the logfile TOSCA.OUT. To see how a
certain executable (e.g. your FE-solver) is called, search the file for
Calling. In the search results you will also see the FE-solver call, e.g.:
(INFO ) [13:29:59|tosca_perl] Calling(17048): "/store2/
app/bin/abaqus" job=shapeV2 analysis interactive --version 6.10-3
The number in parenthesis Calling(<pid>) is the process identification number, PID. |
| Debug output from only one executable |
Using loglevel debug is very verbose and this might be annoying if only logging
from one single executable is of interest. There are two ways of getting
debugging information from a single executable:
|