About Self-Organizing Maps | ||
| ||
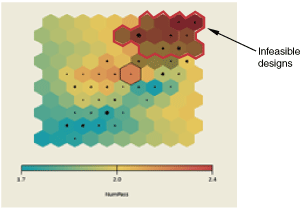
Self-organizing maps are useful in identifying interesting clusters in a data set and relationships among parameters. You can generate and explore several self-organizing maps by modifying the options to discover the trends or relationships in their data set. The following figure shows an example of a self-organizing map:

In Isight a self-organizing map is built using the entire set of rows and columns for a component. SOM looks at all the parameters of two rows simultaneously to determine the similarity between them. The similarity is used to cluster points into bins that are arranged in two dimensions. A self-organizing map can be created for any parameter type (i.e., Input, Output, or Local). The self-organizing map for a particular parameter appears as a 2D hexagonal grid, where each hexagon corresponds to a bin. The color of the bin indicates the parameter value of the points in that bin. Some hexagons contain a circle whose radius indicates the number of points in the node represented by the hexagon. Infeasible regions of the design space are represented by hexagons shaded in dark colors as shown in the figure above.
Isight uses the following process to create a self-organizing map:
- A 2D mesh of nodes (corresponding to a bin) is first created that span the two principle components of the data set. The principle components are the set of axes along which the data spread is greatest.
- By aligning the mesh along the two axes with the greatest spread, the initial self-organizing map can account for a large fraction of the variation seen in the data set.
- In subsequent iterations, Isight examines each data point sequentially and tries to deform the mesh by moving the nodes based on the unaccounted variation.