About Data Set Information | ||
| ||
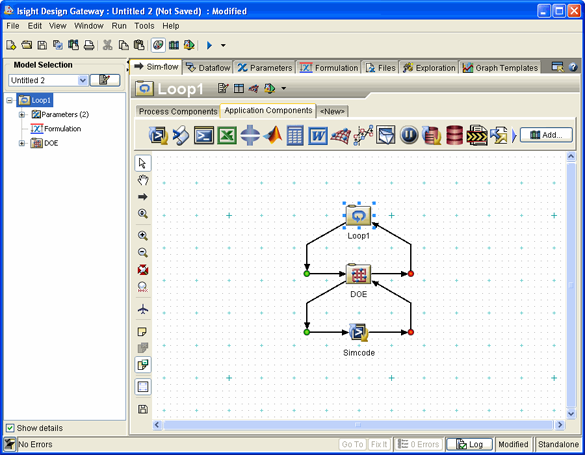
When a process component executes within multiple nested process components, there are multiple data sets that can be used to present the results for that component. For example, consider a model that executes a DOE (100 runs) study around 5 different baseline points (managed by a Loop) as shown below.

When reviewing the history of the Simcode component results, typically you will want to see the results relative to each execution of the DOE (a set of 100 runs). In this case data set controls are provided for selecting and navigating through the multiple data sets (5 different sets in this example).
You can scroll through the available data sets using the Data Set scroll bar, which appears below the graph and table visualization area and above the Run Number scroll bar. This area displays the number of total data sets available and allows you to easily change the displayed data sets.
Note: The Data Set scroll bar is not visible if there is only one data set.
The figure below shows an example of the Data Set scroll bar.
